Fig. 7
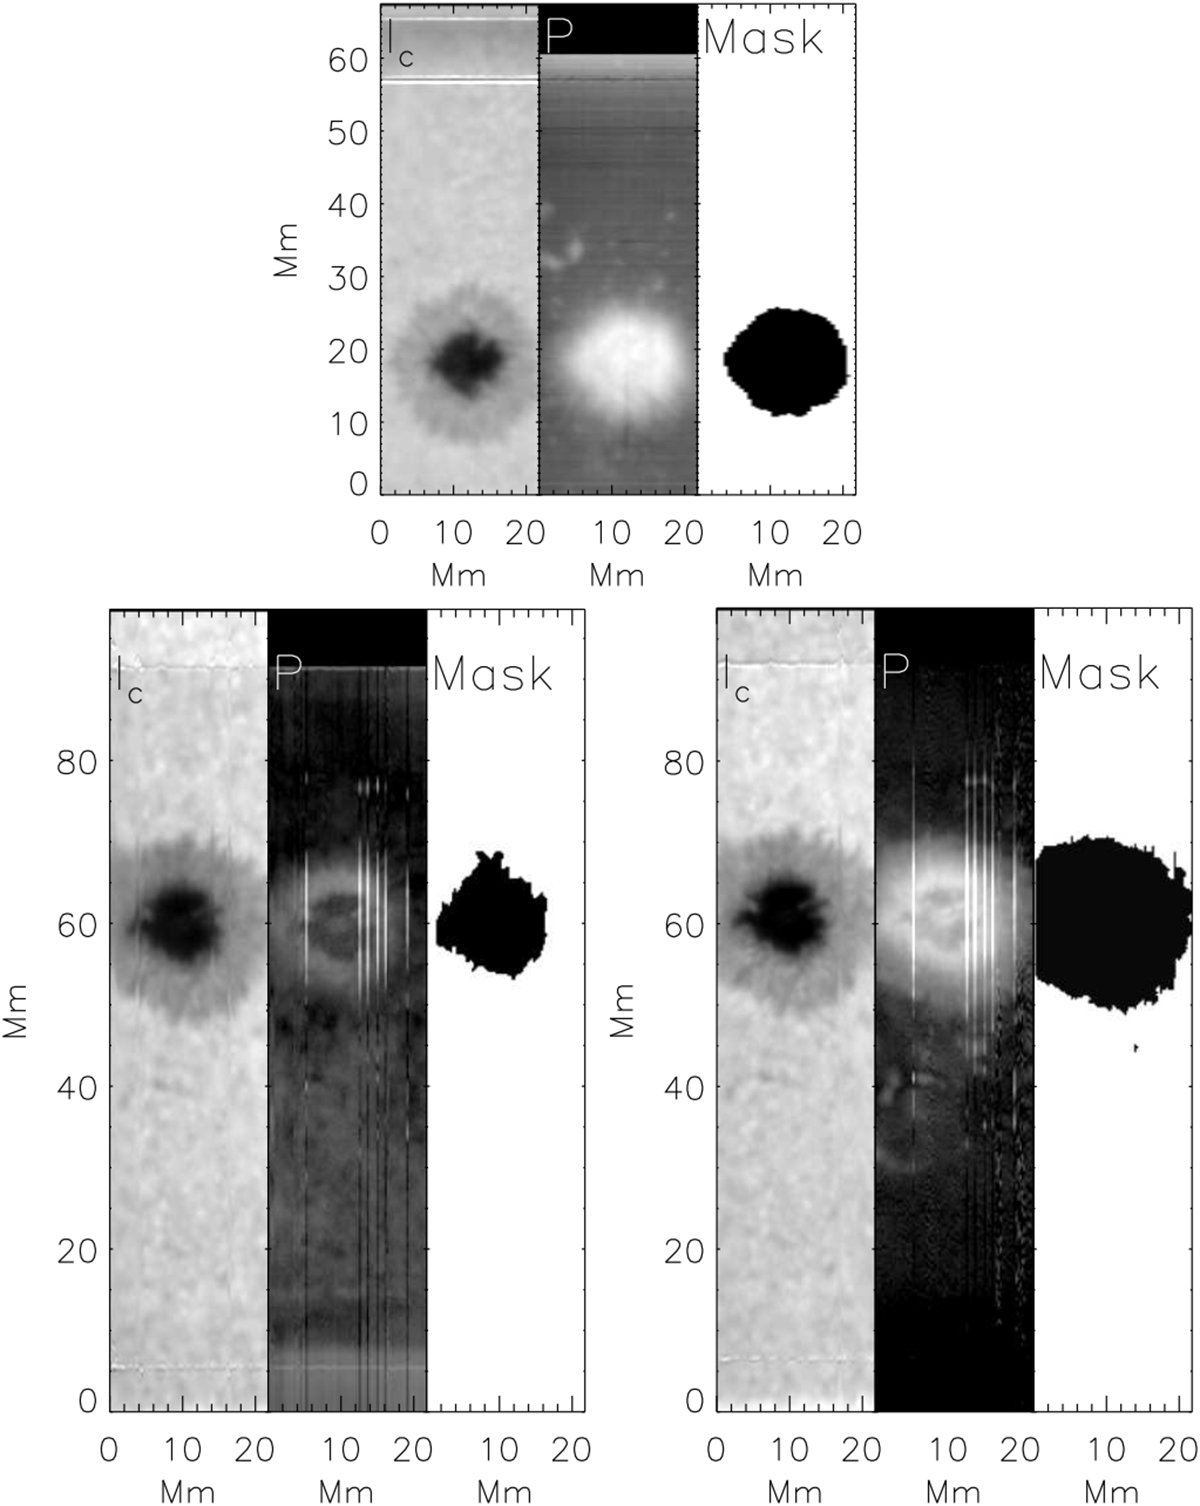
Maps of one scan at 459 nm (bottom left panel), 526 nm (bottom right panel), and 614 nm (top panel). Left to right: continuum intensity, Ic, polarization degree pmax, and mask of significant polarization signal. The vertical bright stripes in pmax for 459 and 526 nm were caused by a temporary loss of the synchronization between polarization modulation and exposures during the scanning.
Current usage metrics show cumulative count of Article Views (full-text article views including HTML views, PDF and ePub downloads, according to the available data) and Abstracts Views on Vision4Press platform.
Data correspond to usage on the plateform after 2015. The current usage metrics is available 48-96 hours after online publication and is updated daily on week days.
Initial download of the metrics may take a while.