Fig. B.1
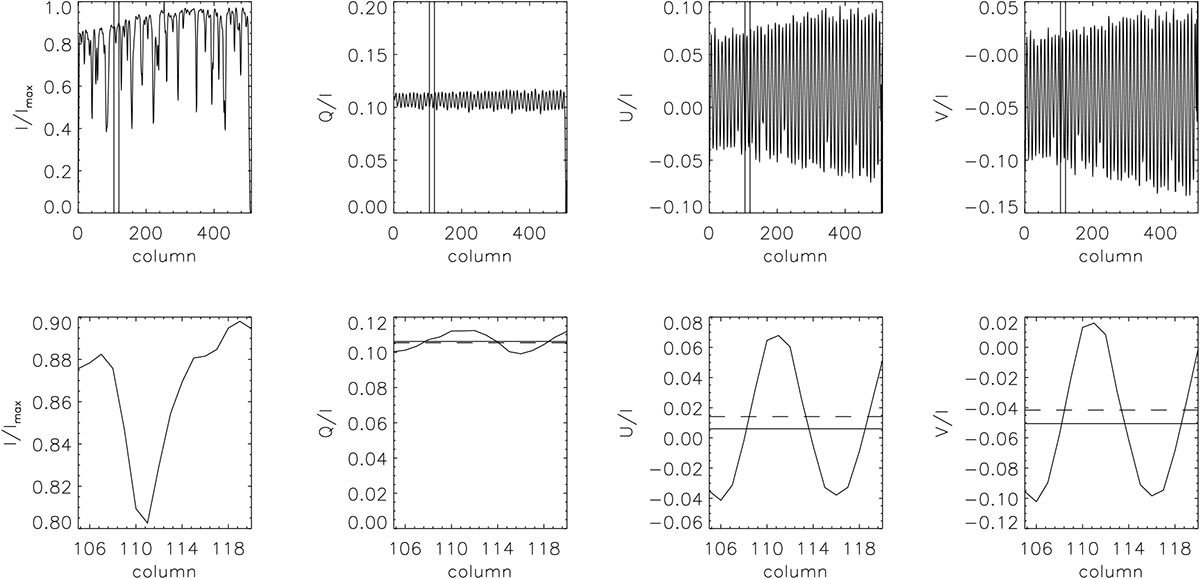
Determination of the I → QUV crosstalk at 459 nm. Left to right: Stokes I, Q∕I, U∕I, and V∕I for a single, randomly picked profile. Top row: full spectrum. The two vertical lines indicate the location of the continuum wavelength window used in the determination of I → QUV. Bottom row: spectrum inside the continuum wavelength window. The horizontal solid and dashed lines indicate the average value in the continuum window and the full spectrum, respectively.
Current usage metrics show cumulative count of Article Views (full-text article views including HTML views, PDF and ePub downloads, according to the available data) and Abstracts Views on Vision4Press platform.
Data correspond to usage on the plateform after 2015. The current usage metrics is available 48-96 hours after online publication and is updated daily on week days.
Initial download of the metrics may take a while.