Fig. A.3
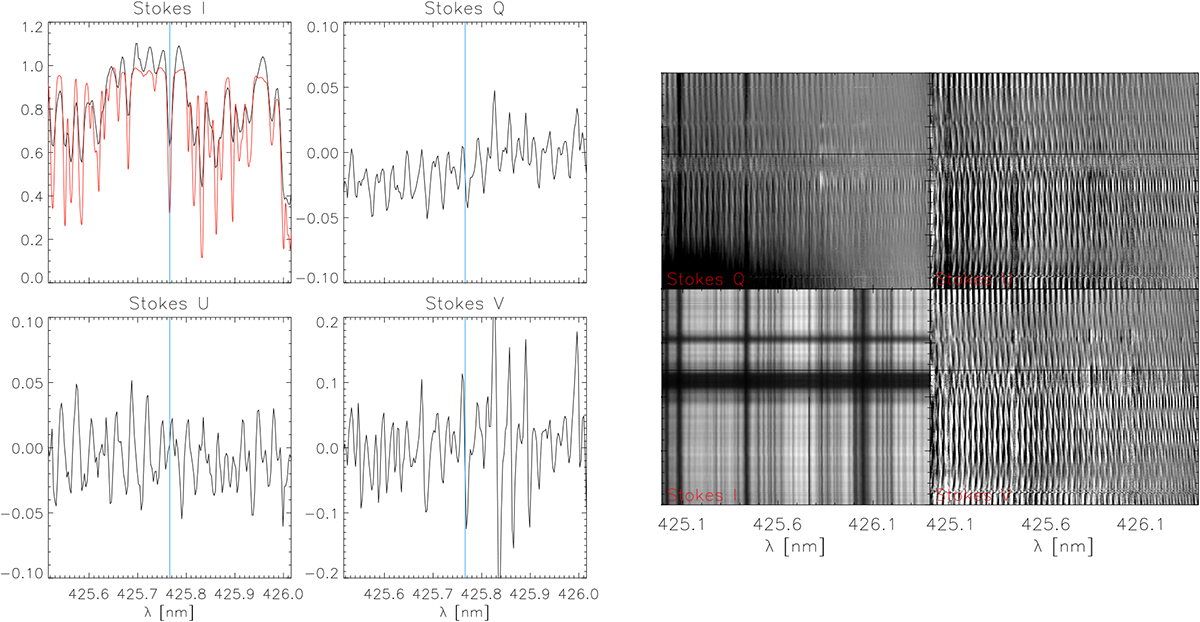
Observed example spectra of Mn I at 425.8 nm. Left four panels: individual IQUV profiles from the location indicated with a horizontal black line in the right panels. The red line shows the corresponding profile from the FTS atlas. Right four panels: slit spectra of (clockwise, starting left bottom) IQUV on a cut across the center of a sunspot. The line without LP is indicated by a black vertical bar.
Current usage metrics show cumulative count of Article Views (full-text article views including HTML views, PDF and ePub downloads, according to the available data) and Abstracts Views on Vision4Press platform.
Data correspond to usage on the plateform after 2015. The current usage metrics is available 48-96 hours after online publication and is updated daily on week days.
Initial download of the metrics may take a while.