Fig. 14
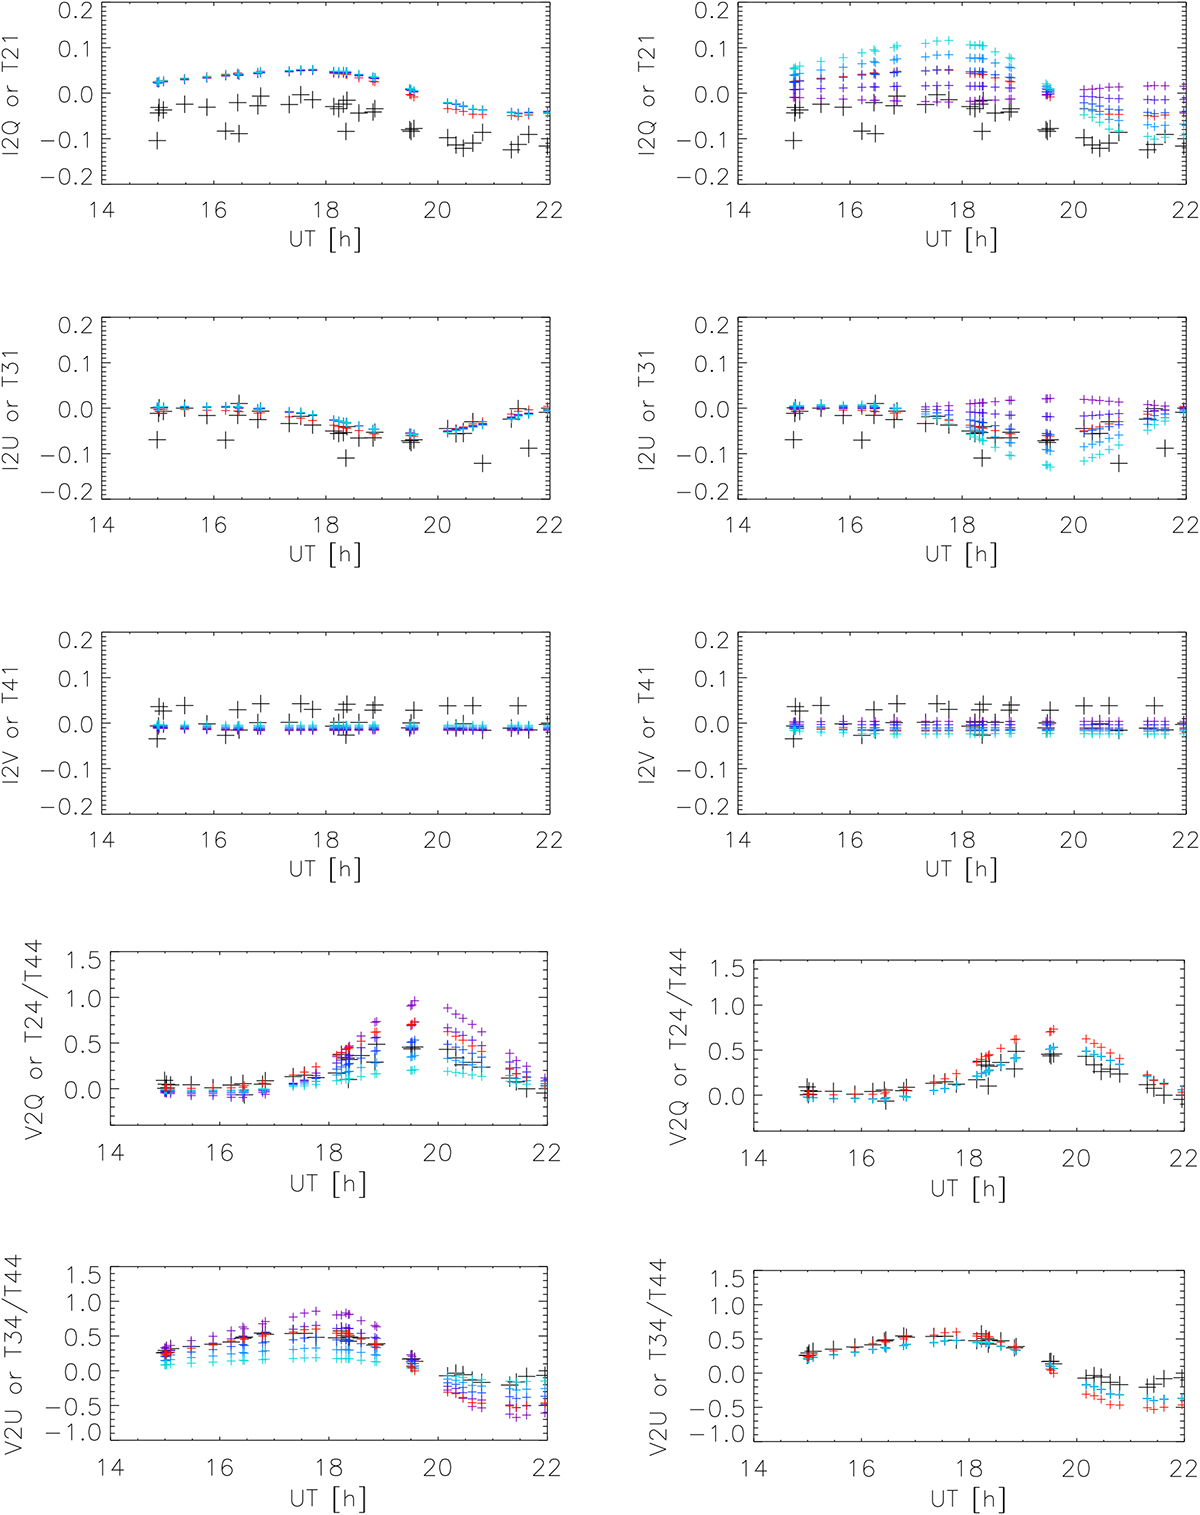
Sensitivity test of the telescope model at a wavelength of 614.9 nm. Top three rows: change in I → QUV for a variation of the mirror retardance τ (left column) and the ratio of reflectivities X (right column). Observations are given by black plus symbols, while the red plus symbols correspond to the 2010 parameter set. τ and X were varied from −10 to 10 and −0.1 to 0.1, respectively. The resulting curves are indicated by the series of blue to purple plus symbols. Bottom two rows: change in V → QU for a variation of the mirror retardance τ (left column) and the ratio of reflectivities X (right column).
Current usage metrics show cumulative count of Article Views (full-text article views including HTML views, PDF and ePub downloads, according to the available data) and Abstracts Views on Vision4Press platform.
Data correspond to usage on the plateform after 2015. The current usage metrics is available 48-96 hours after online publication and is updated daily on week days.
Initial download of the metrics may take a while.