Free Access
Fig. 13
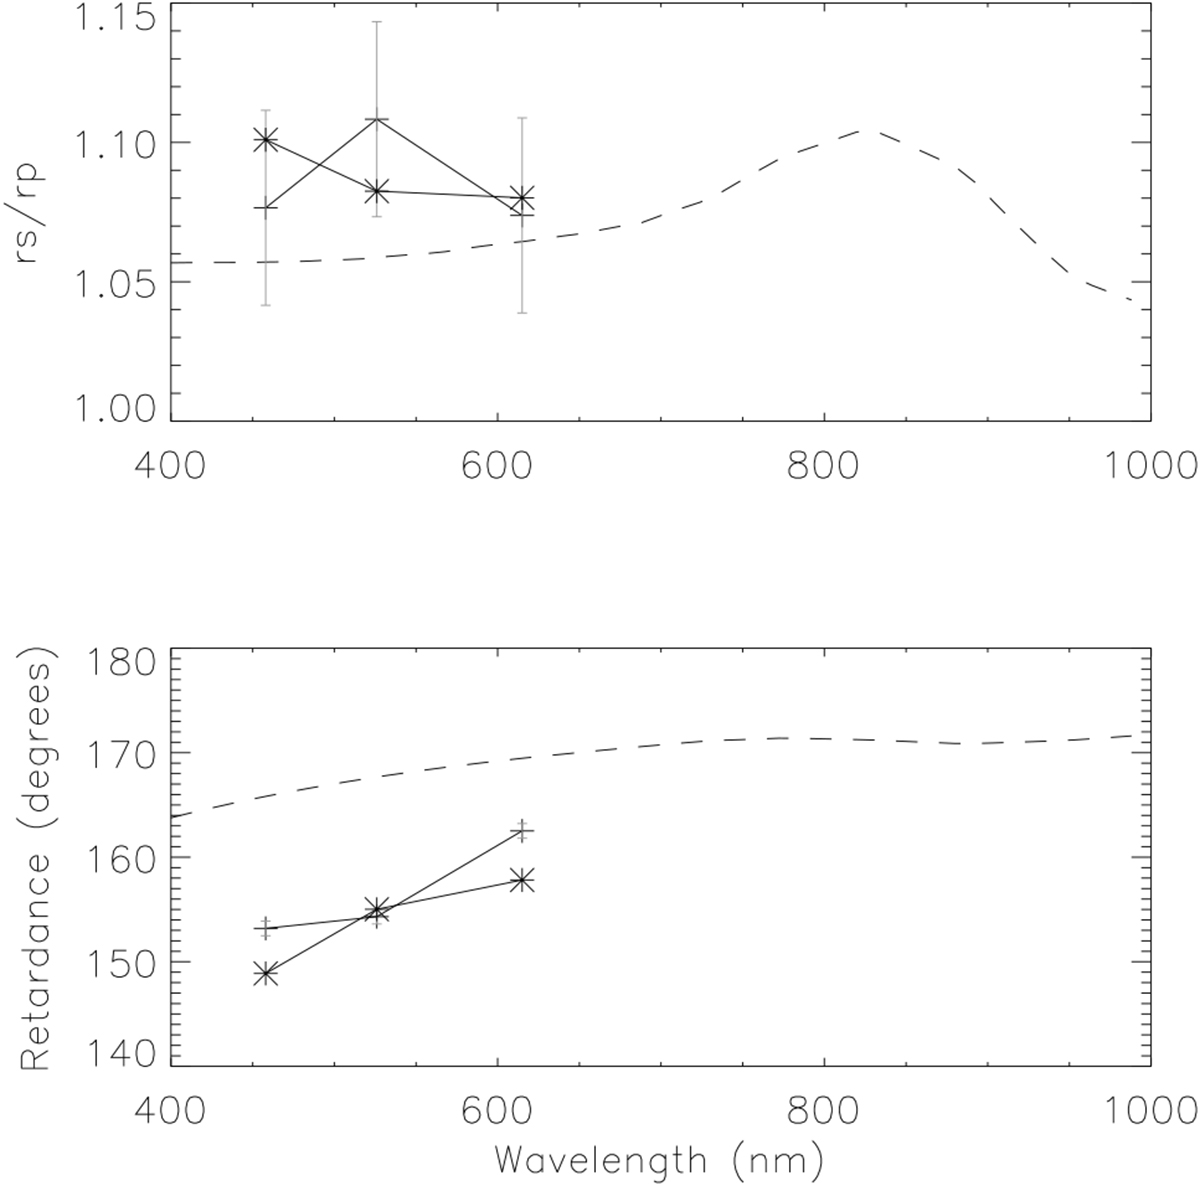
Values of X (top panel) and τ (bottom panel) for the literature values (dashed lines), the 2010 telescope model parameters (asterisks), and the current 2016 fit results (crosses). The vertical gray lines show error estimates of ± 1° (bottom panel) and ±0.035 (top panel).
Current usage metrics show cumulative count of Article Views (full-text article views including HTML views, PDF and ePub downloads, according to the available data) and Abstracts Views on Vision4Press platform.
Data correspond to usage on the plateform after 2015. The current usage metrics is available 48-96 hours after online publication and is updated daily on week days.
Initial download of the metrics may take a while.