Fig. 11
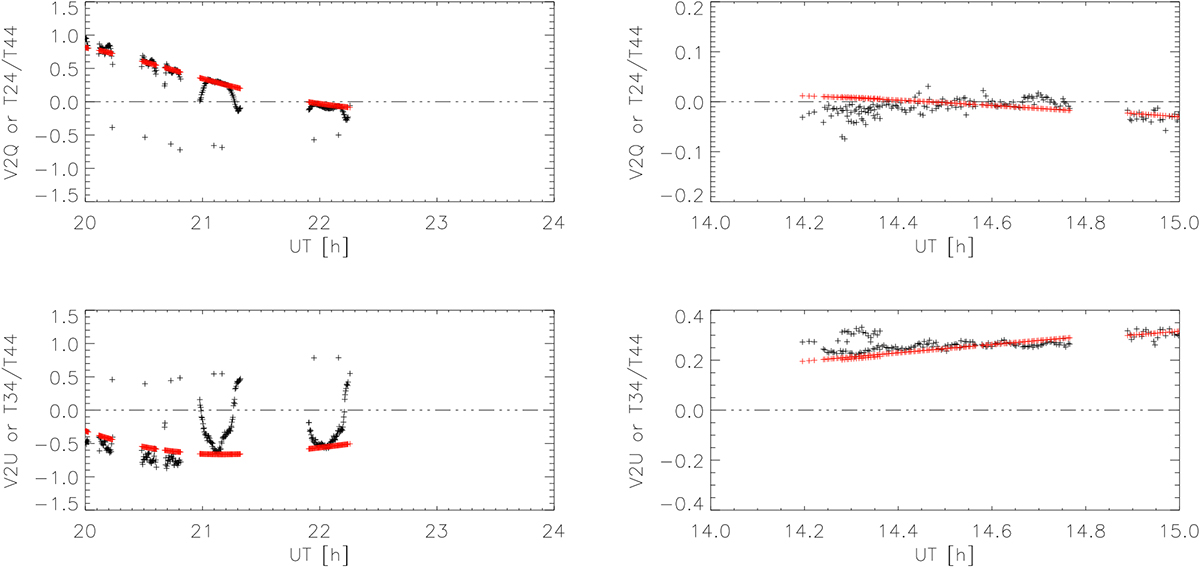
Left column: magnification of the V → QU crosstalk at 526.2 nm for observations taken between UT 20 and 24. Individual maps lasted for approximately 30 min. Most scans show a dominant parabolic shape of the crosstalk values (seen also in Fig. 10). Only the central position of the scan yields a value that agrees with the 2010 telescope model. Right column: same for data taken in 2017 at 614.9 nm with the SPINOR modulator in a collimated beam.
Current usage metrics show cumulative count of Article Views (full-text article views including HTML views, PDF and ePub downloads, according to the available data) and Abstracts Views on Vision4Press platform.
Data correspond to usage on the plateform after 2015. The current usage metrics is available 48-96 hours after online publication and is updated daily on week days.
Initial download of the metrics may take a while.