Fig. 10
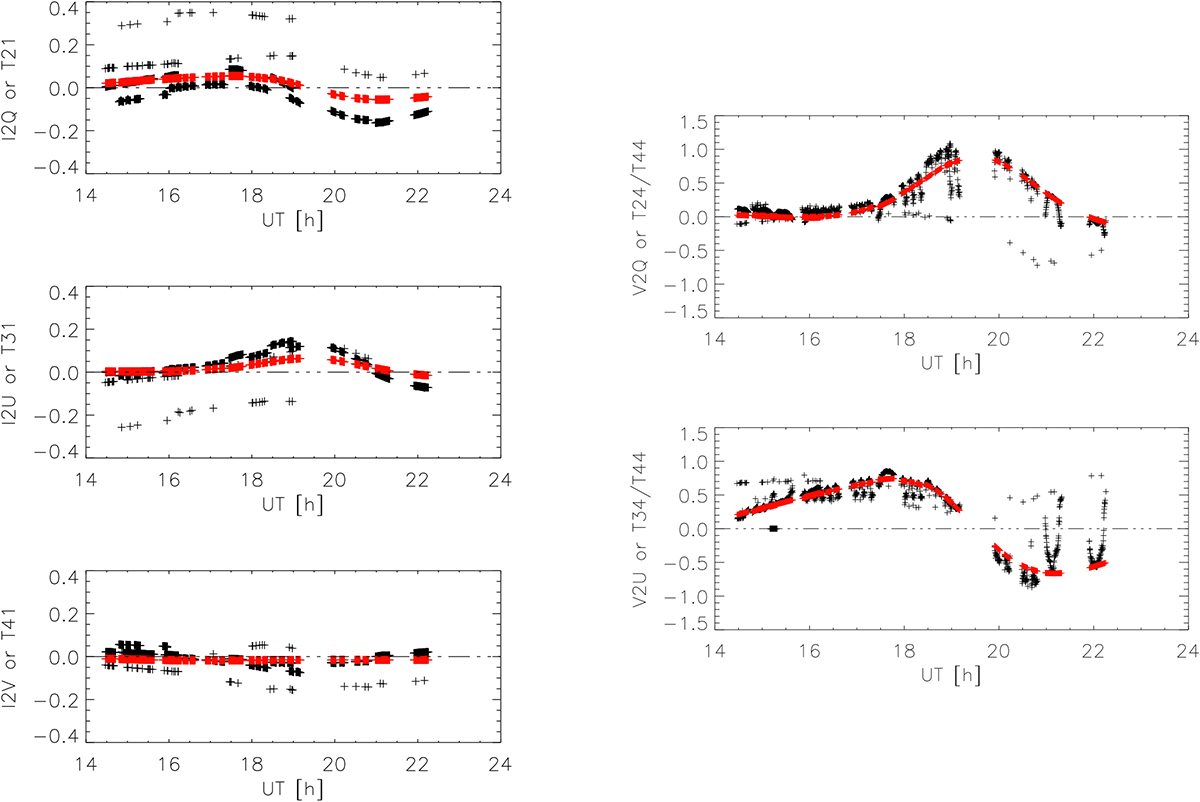
Input to the fit of telescope parameters derived from all observations of 526.2 nm during the campaign. Left column, top to bottom: observed I → QUV crosstalk (black crosses). Right column, top to bottom: V → QU crosstalk. The red crosses show the corresponding values of the DST telescope model using the 2010 model parameters.
Current usage metrics show cumulative count of Article Views (full-text article views including HTML views, PDF and ePub downloads, according to the available data) and Abstracts Views on Vision4Press platform.
Data correspond to usage on the plateform after 2015. The current usage metrics is available 48-96 hours after online publication and is updated daily on week days.
Initial download of the metrics may take a while.