Free Access
Fig. 1
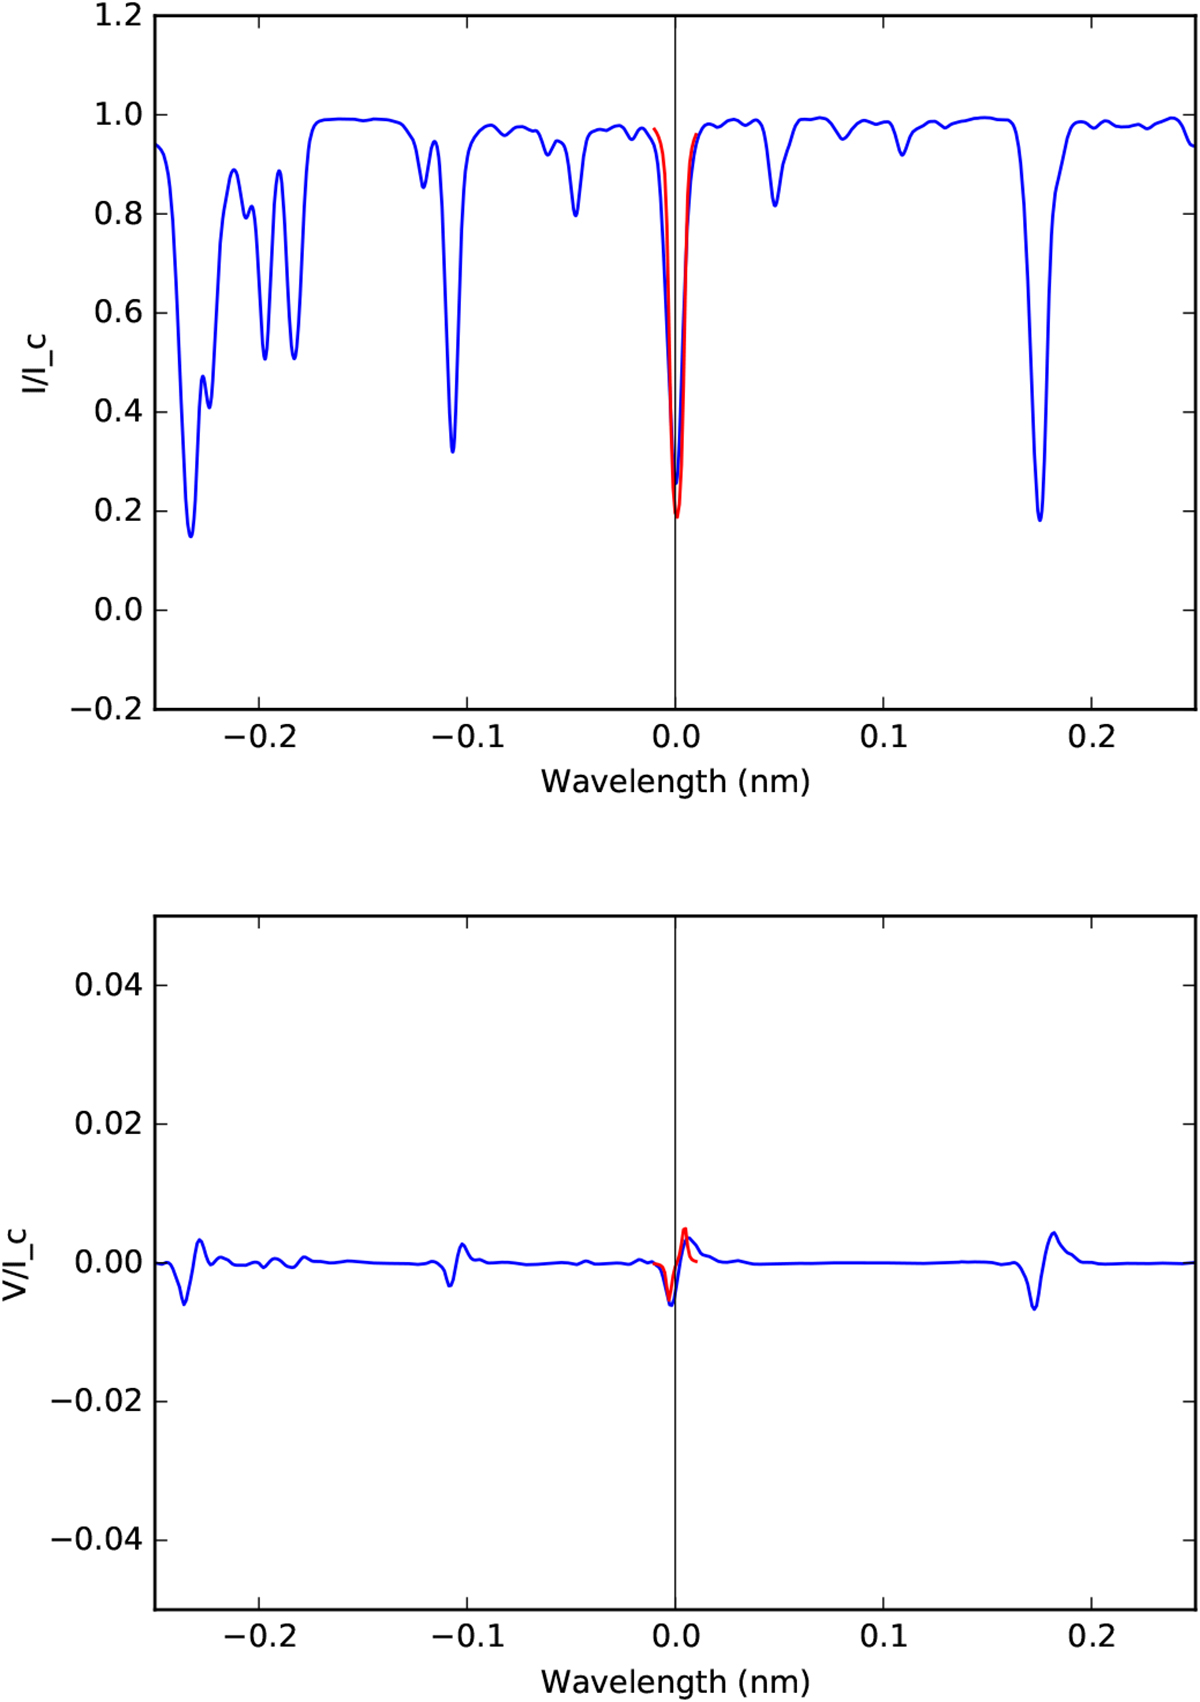
Synthetic Stokes profiles of Stokes I (top panel) and V (bottom panel) for the Cr II line at 458.820 nm in the synthesis with 1500 G shown in red. The blue lines show the corresponding profiles from the FTS atlas.
Current usage metrics show cumulative count of Article Views (full-text article views including HTML views, PDF and ePub downloads, according to the available data) and Abstracts Views on Vision4Press platform.
Data correspond to usage on the plateform after 2015. The current usage metrics is available 48-96 hours after online publication and is updated daily on week days.
Initial download of the metrics may take a while.