Fig. 6
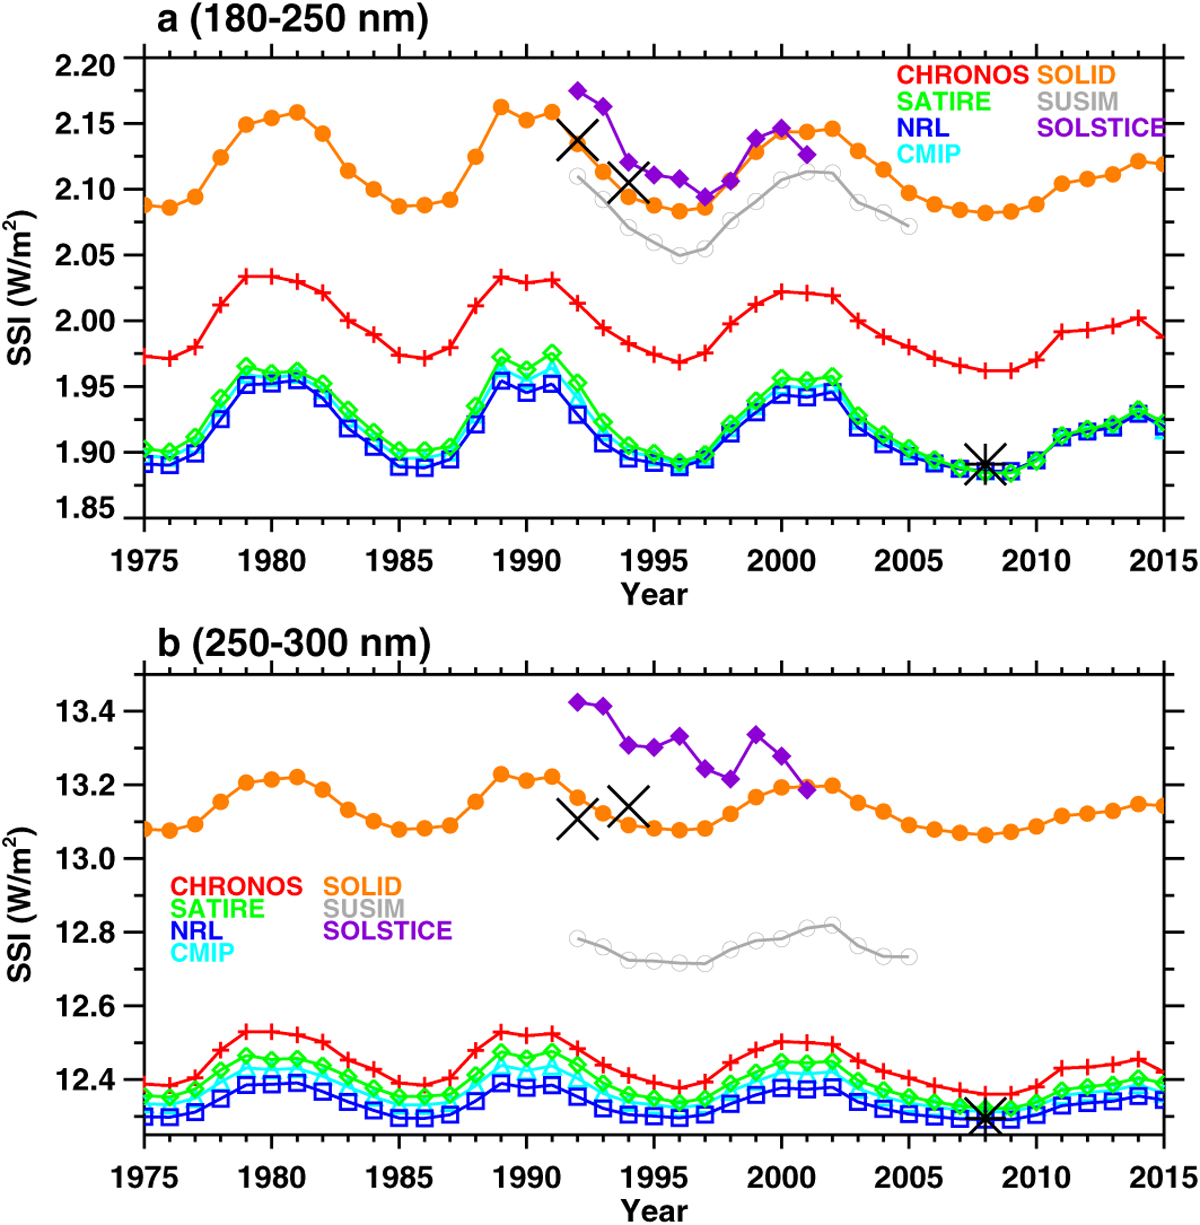
Evolution of the band-integrated annual mean spectral solar irradiance (W m−2) calculated using CHRONOS (red line, pluses) in comparison with SATIRE-S (green line, open diamonds), NRLSSI2 (blue line, open squares), CMIP-6 (light-blue line, open triangles), UARS SUSIM (grey line, open circles), UARS SOLSTICE (violet line, filled diamonds), and SOLID composite (orange line, filled circles). The data from the reference spectral measurements in 1992, 1994 (ATLAS missions), and 2008 (WHI mission) are shown by crosses and the asterisk. Panels a and b show the results for the wavelengths intervals 180–250 nm and 250–300 nm respectively.
Current usage metrics show cumulative count of Article Views (full-text article views including HTML views, PDF and ePub downloads, according to the available data) and Abstracts Views on Vision4Press platform.
Data correspond to usage on the plateform after 2015. The current usage metrics is available 48-96 hours after online publication and is updated daily on week days.
Initial download of the metrics may take a while.