Fig. 5
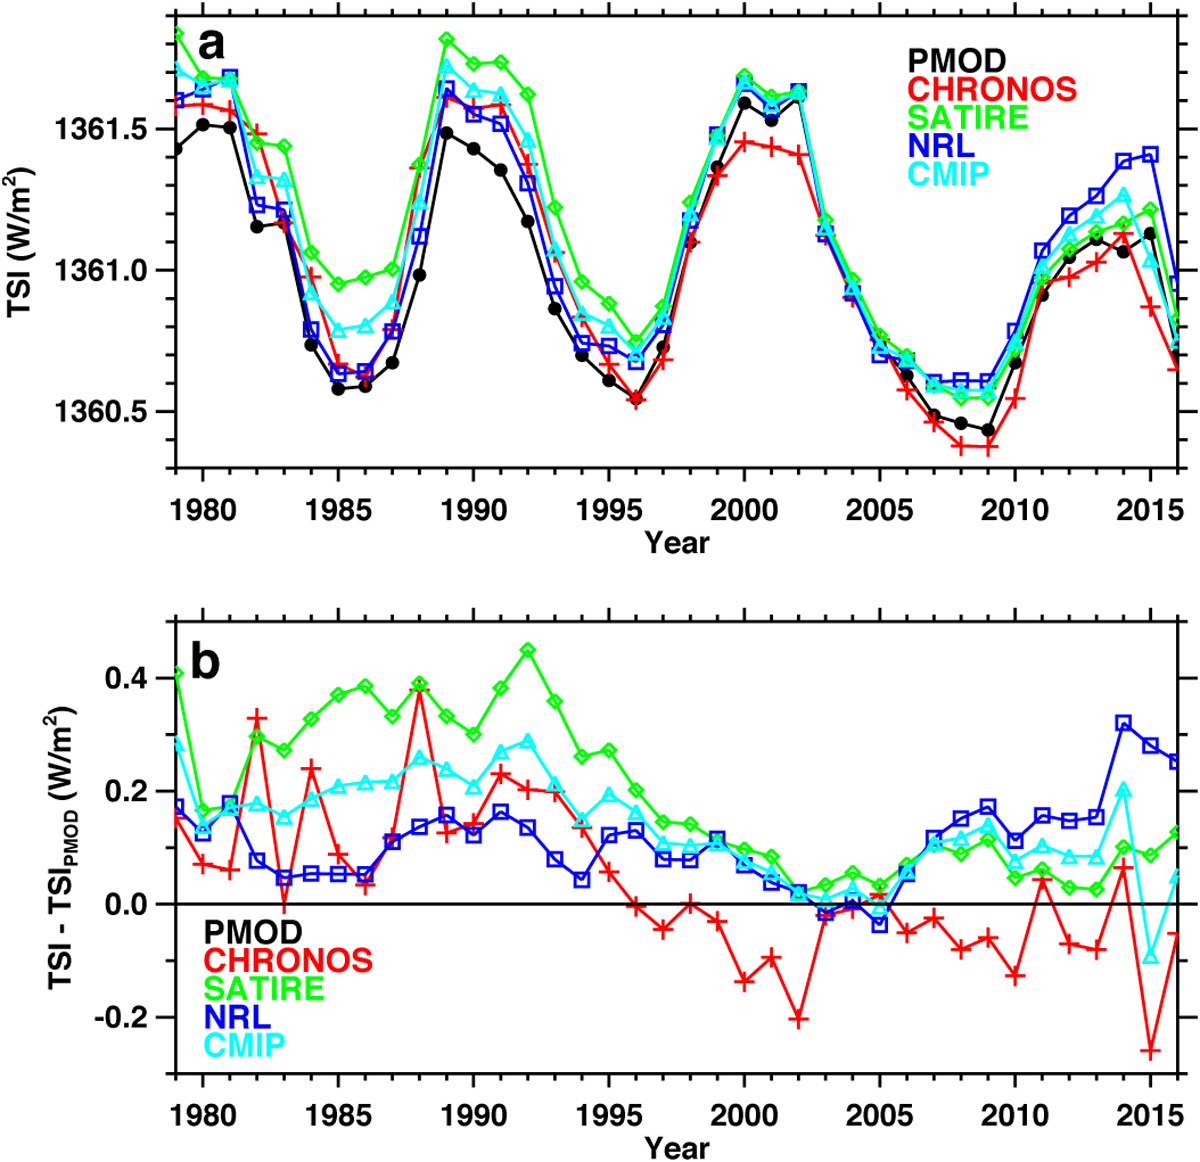
Panel a: evolution of the total solar irradiance (TSI, W/m2) calculated with CHRONOS using the McCracken and Beer (2017, priv. comm.) solar modulation potential (red line, pluses) in comparison with the PMOD composite (black line, filed circles), the SATIRE-S (green line, open diamonds), the NRLSSI2 (blue line, open squares) models, and solar irradiance prepared in the framework of the CMIP-6 project (light-blue line, open triangles). Panel b: deviations of the TSI reconstructions from the PMOD composite.
Current usage metrics show cumulative count of Article Views (full-text article views including HTML views, PDF and ePub downloads, according to the available data) and Abstracts Views on Vision4Press platform.
Data correspond to usage on the plateform after 2015. The current usage metrics is available 48-96 hours after online publication and is updated daily on week days.
Initial download of the metrics may take a while.