Free Access
Fig. 4
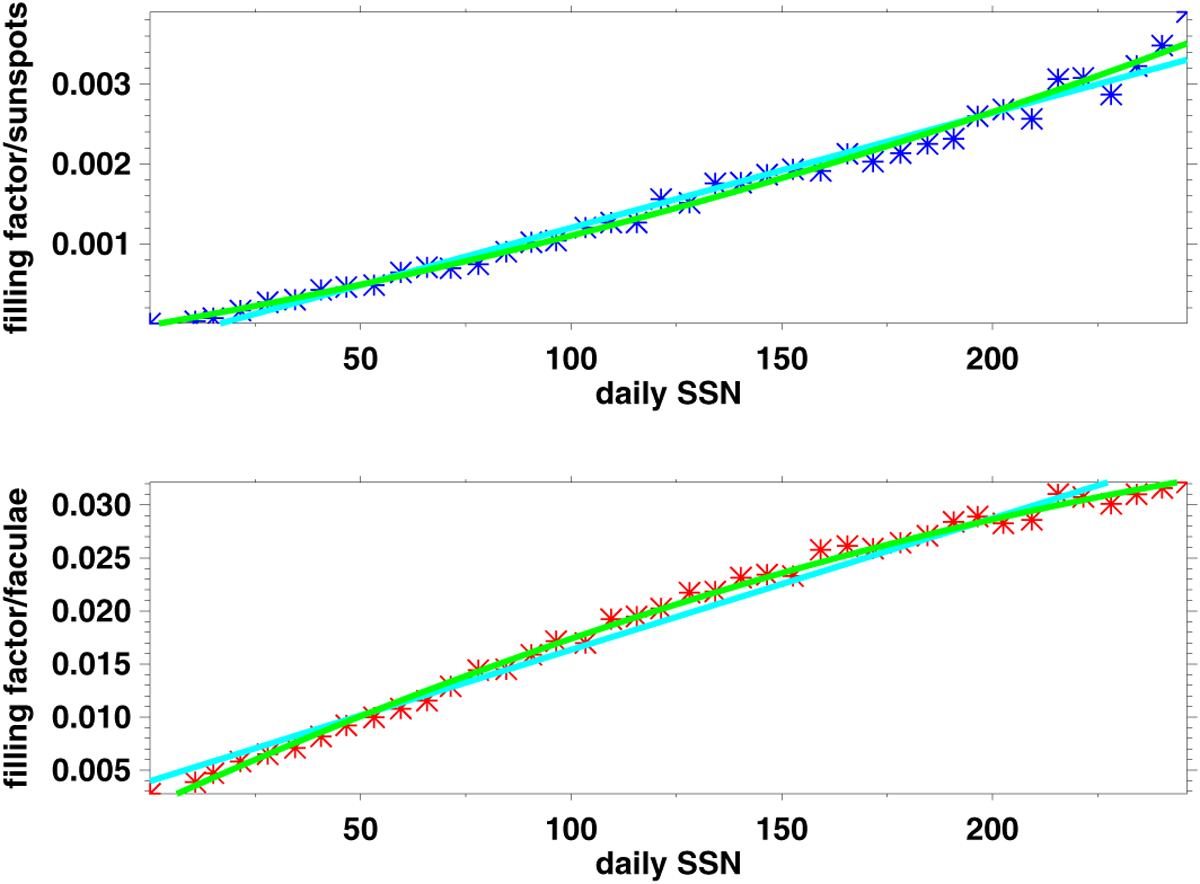
Daily sunspot (top, blue asterisks) and facular (bottom, red asterisks) filling factors grouped into 40 bins as a function of SSN. Light blue line represents linear and green line represents second order polynomial fits.
Current usage metrics show cumulative count of Article Views (full-text article views including HTML views, PDF and ePub downloads, according to the available data) and Abstracts Views on Vision4Press platform.
Data correspond to usage on the plateform after 2015. The current usage metrics is available 48-96 hours after online publication and is updated daily on week days.
Initial download of the metrics may take a while.