Fig. 9
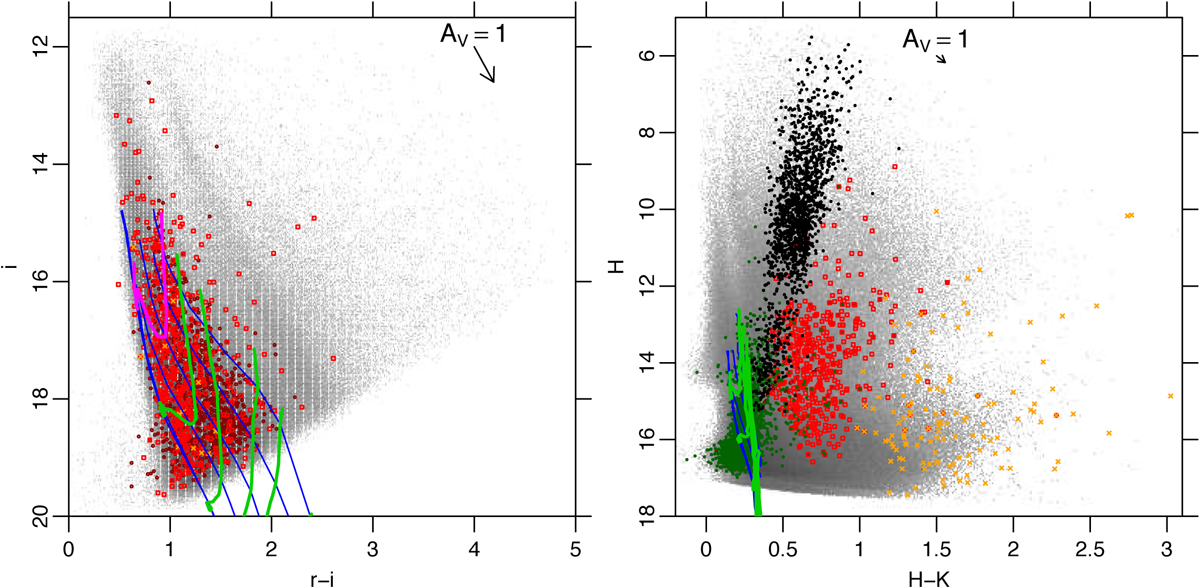
Color-magnitude diagrams for all stars in the Sco OB1 region (left panel: (i, r − i); right panel: (H, H − K)). Only datawith errors less than 0.1 mag on colors and magnitudes are shown. Colored symbols, tracks, and isochrones as in Fig. 6. The magenta isochrone in the left panel corresponds to 1 M⊙ stars. In the (H, H − K) diagram, dark-green dots indicate all candidate M dwarf (or PMS) stars, while black dots are candidate M giants.
Current usage metrics show cumulative count of Article Views (full-text article views including HTML views, PDF and ePub downloads, according to the available data) and Abstracts Views on Vision4Press platform.
Data correspond to usage on the plateform after 2015. The current usage metrics is available 48-96 hours after online publication and is updated daily on week days.
Initial download of the metrics may take a while.