Fig. 6
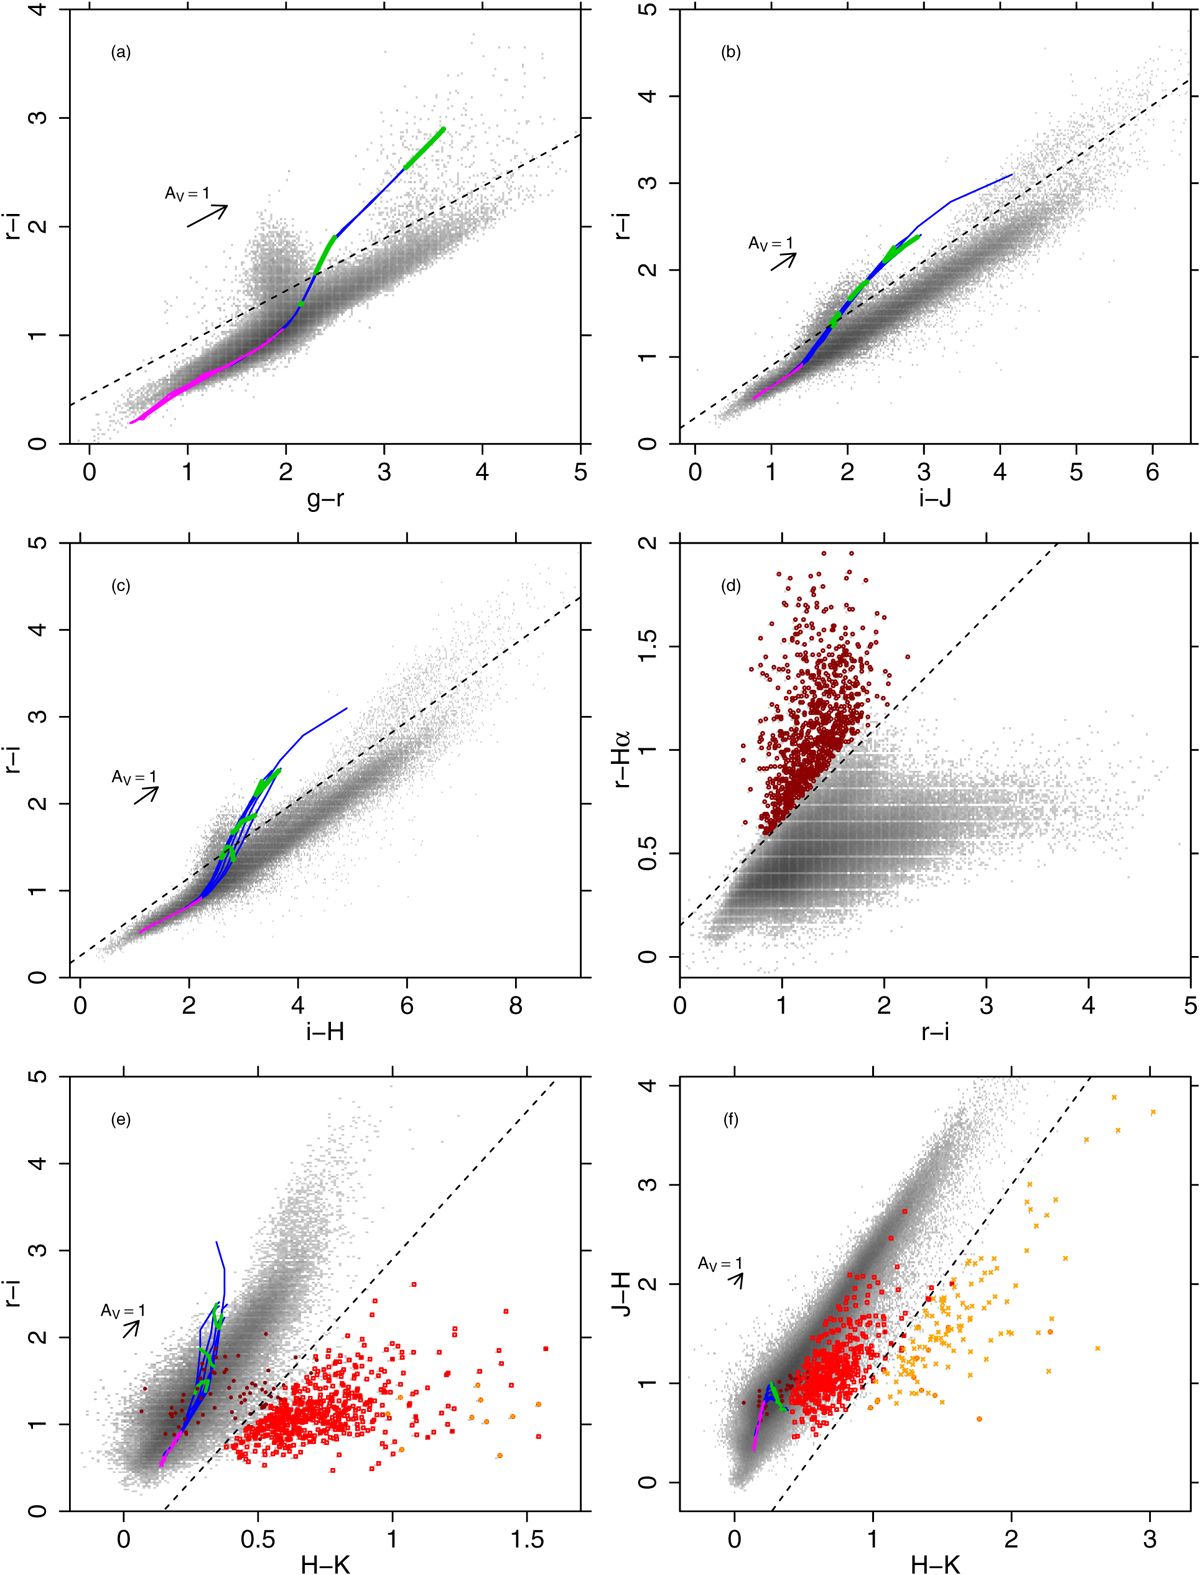
Color-color diagrams used for selection of young stars. Each diagram is a two-dimensional histogram, with shades of gray indicating the density of datapoints. Only data with errors less than 0.1 mag on each pair of colors are shown. Panels a–c: M stars are found above the dashed lines. Panel d: strong Hα-emission stars are found above the dashed line (dark-red points). Panels e–f: IR-excess stars are found below the dashed lines (red squares: selected from (H − K, r − i) diagram; orange crosses: selected from (H − K, J − H) diagram; dark-red points from panel d). Representative reddening vectors are shown, except in panel d where reddening moves datapoints along curved trajectories. BHAC isochrones (evolutionary tracks) are shown with blue (green) lines for ages 1, 10, 50, and 10 000 Myr (masses of 0.1, 0.3, and 0.5 M⊙), reddened as appropriate for NGC 6231 (AV = 1.5). The locationof stars with mass M > 1 M⊙ (all ages) is indicated with a magenta curve. In panel a only, Siess et al. (2000) isochrones and tracks are used, the BHAC set being unavailable for the g band.
Current usage metrics show cumulative count of Article Views (full-text article views including HTML views, PDF and ePub downloads, according to the available data) and Abstracts Views on Vision4Press platform.
Data correspond to usage on the plateform after 2015. The current usage metrics is available 48-96 hours after online publication and is updated daily on week days.
Initial download of the metrics may take a while.