Free Access
Fig. 20
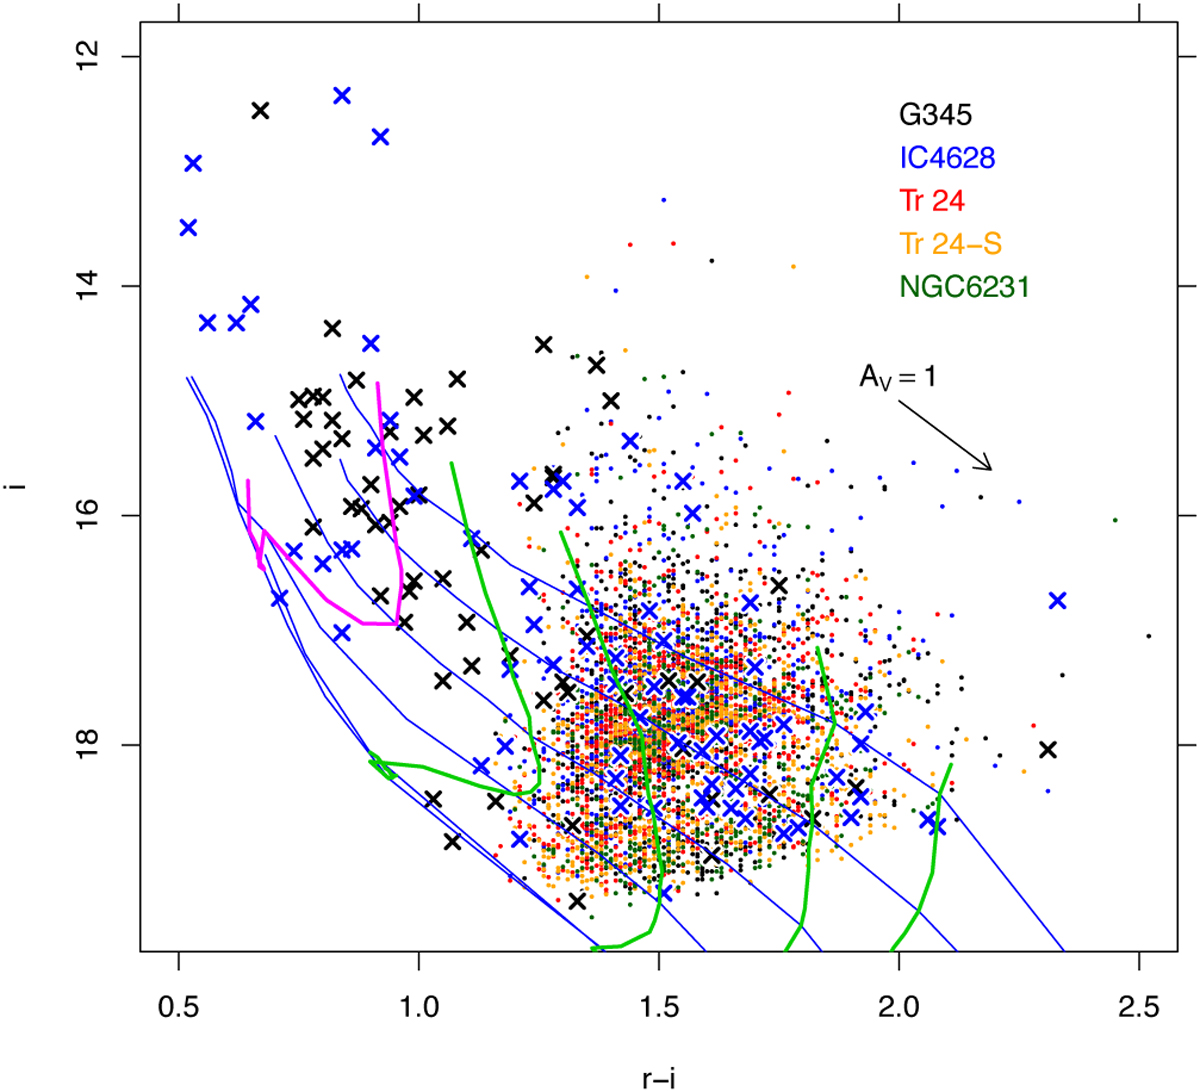
The (i, r − i) CMD of all M stars, color-coded by spatial region. Also shown are X-ray detections from XMM-Newton (black crosses) and Chandra (blue crosses). Tracks and isochrones as in Fig. 9.
Current usage metrics show cumulative count of Article Views (full-text article views including HTML views, PDF and ePub downloads, according to the available data) and Abstracts Views on Vision4Press platform.
Data correspond to usage on the plateform after 2015. The current usage metrics is available 48-96 hours after online publication and is updated daily on week days.
Initial download of the metrics may take a while.