Fig. 10
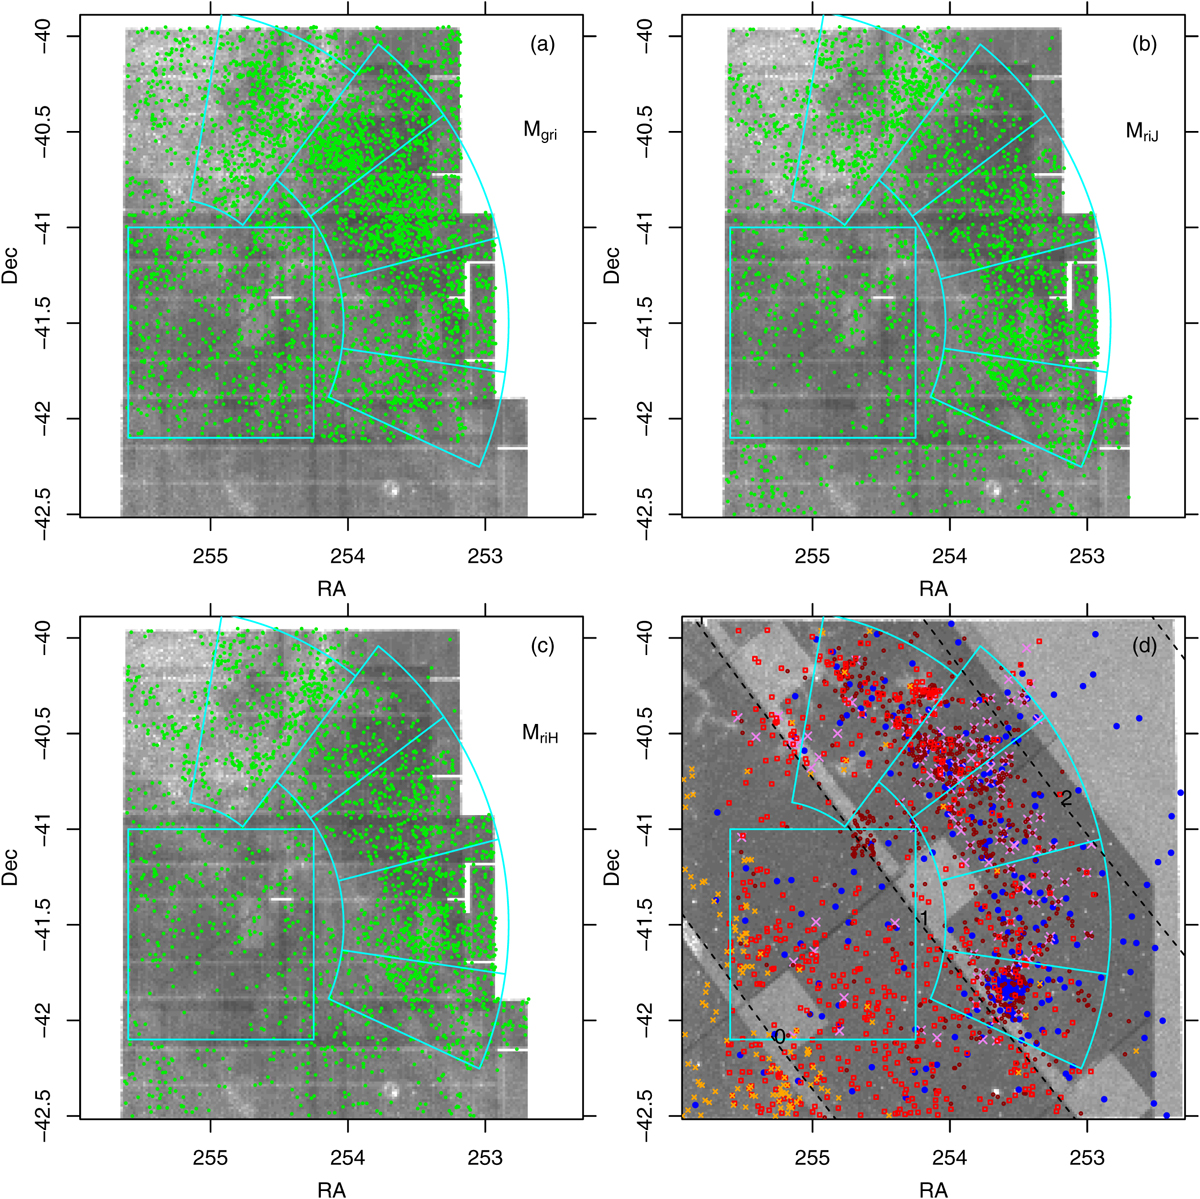
Spatial distributions of star subsamples in Sco OB1. The background image is a two-dimensional density histogram of stars in VPHAS+ DR2 (and sources in our NIR catalog in the bottom right panel). Top left panel: Mgri stars (green)selected from Fig. 6a. Top right panel: MriJ stars (green)from Fig. 6b. Bottom left panel: MriH stars (green) from Fig. 6c. Bottom right panel: dark-red points, red squares and orange crosses are Hα-emission stars, and stars with optical-NIR and NIR excesses, respectively, as in Fig. 6; larger purple crosses are UV-excess stars from Fig. 7; big blue dots are O or B stars from SIMBAD. Oblique dashed black lines indicate constant galactic latitude b, as labeled. Spatial subregions of interest are indicated in all panels with cyan borders.
Current usage metrics show cumulative count of Article Views (full-text article views including HTML views, PDF and ePub downloads, according to the available data) and Abstracts Views on Vision4Press platform.
Data correspond to usage on the plateform after 2015. The current usage metrics is available 48-96 hours after online publication and is updated daily on week days.
Initial download of the metrics may take a while.