Fig. 2
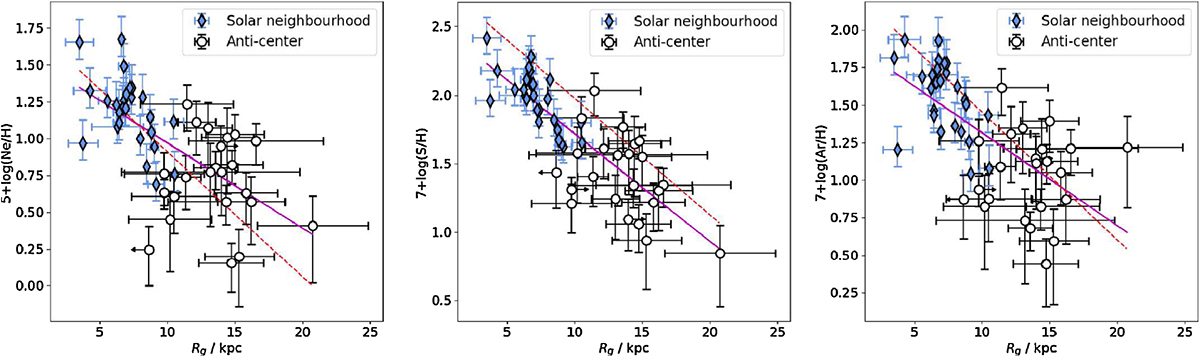
Abundance gradients of neon, sulphur, and argon in the Milky Way. The dashed lines represent the oxygen abundance gradient from within the Galactic disk with a slope of −0.085 dex/kpc (Pottasch & Bernard-Salas 2006), passing through the solar value at 8.0 kpc (Asplund et al. 2005). The solid lines represent the line of best fit in each plot, with gradients of −0.058 ± 0.021, −0.079 ± 0.012 and −0.062 ± 0.023 dex/kpc respectively.
Current usage metrics show cumulative count of Article Views (full-text article views including HTML views, PDF and ePub downloads, according to the available data) and Abstracts Views on Vision4Press platform.
Data correspond to usage on the plateform after 2015. The current usage metrics is available 48-96 hours after online publication and is updated daily on week days.
Initial download of the metrics may take a while.