Fig. 9
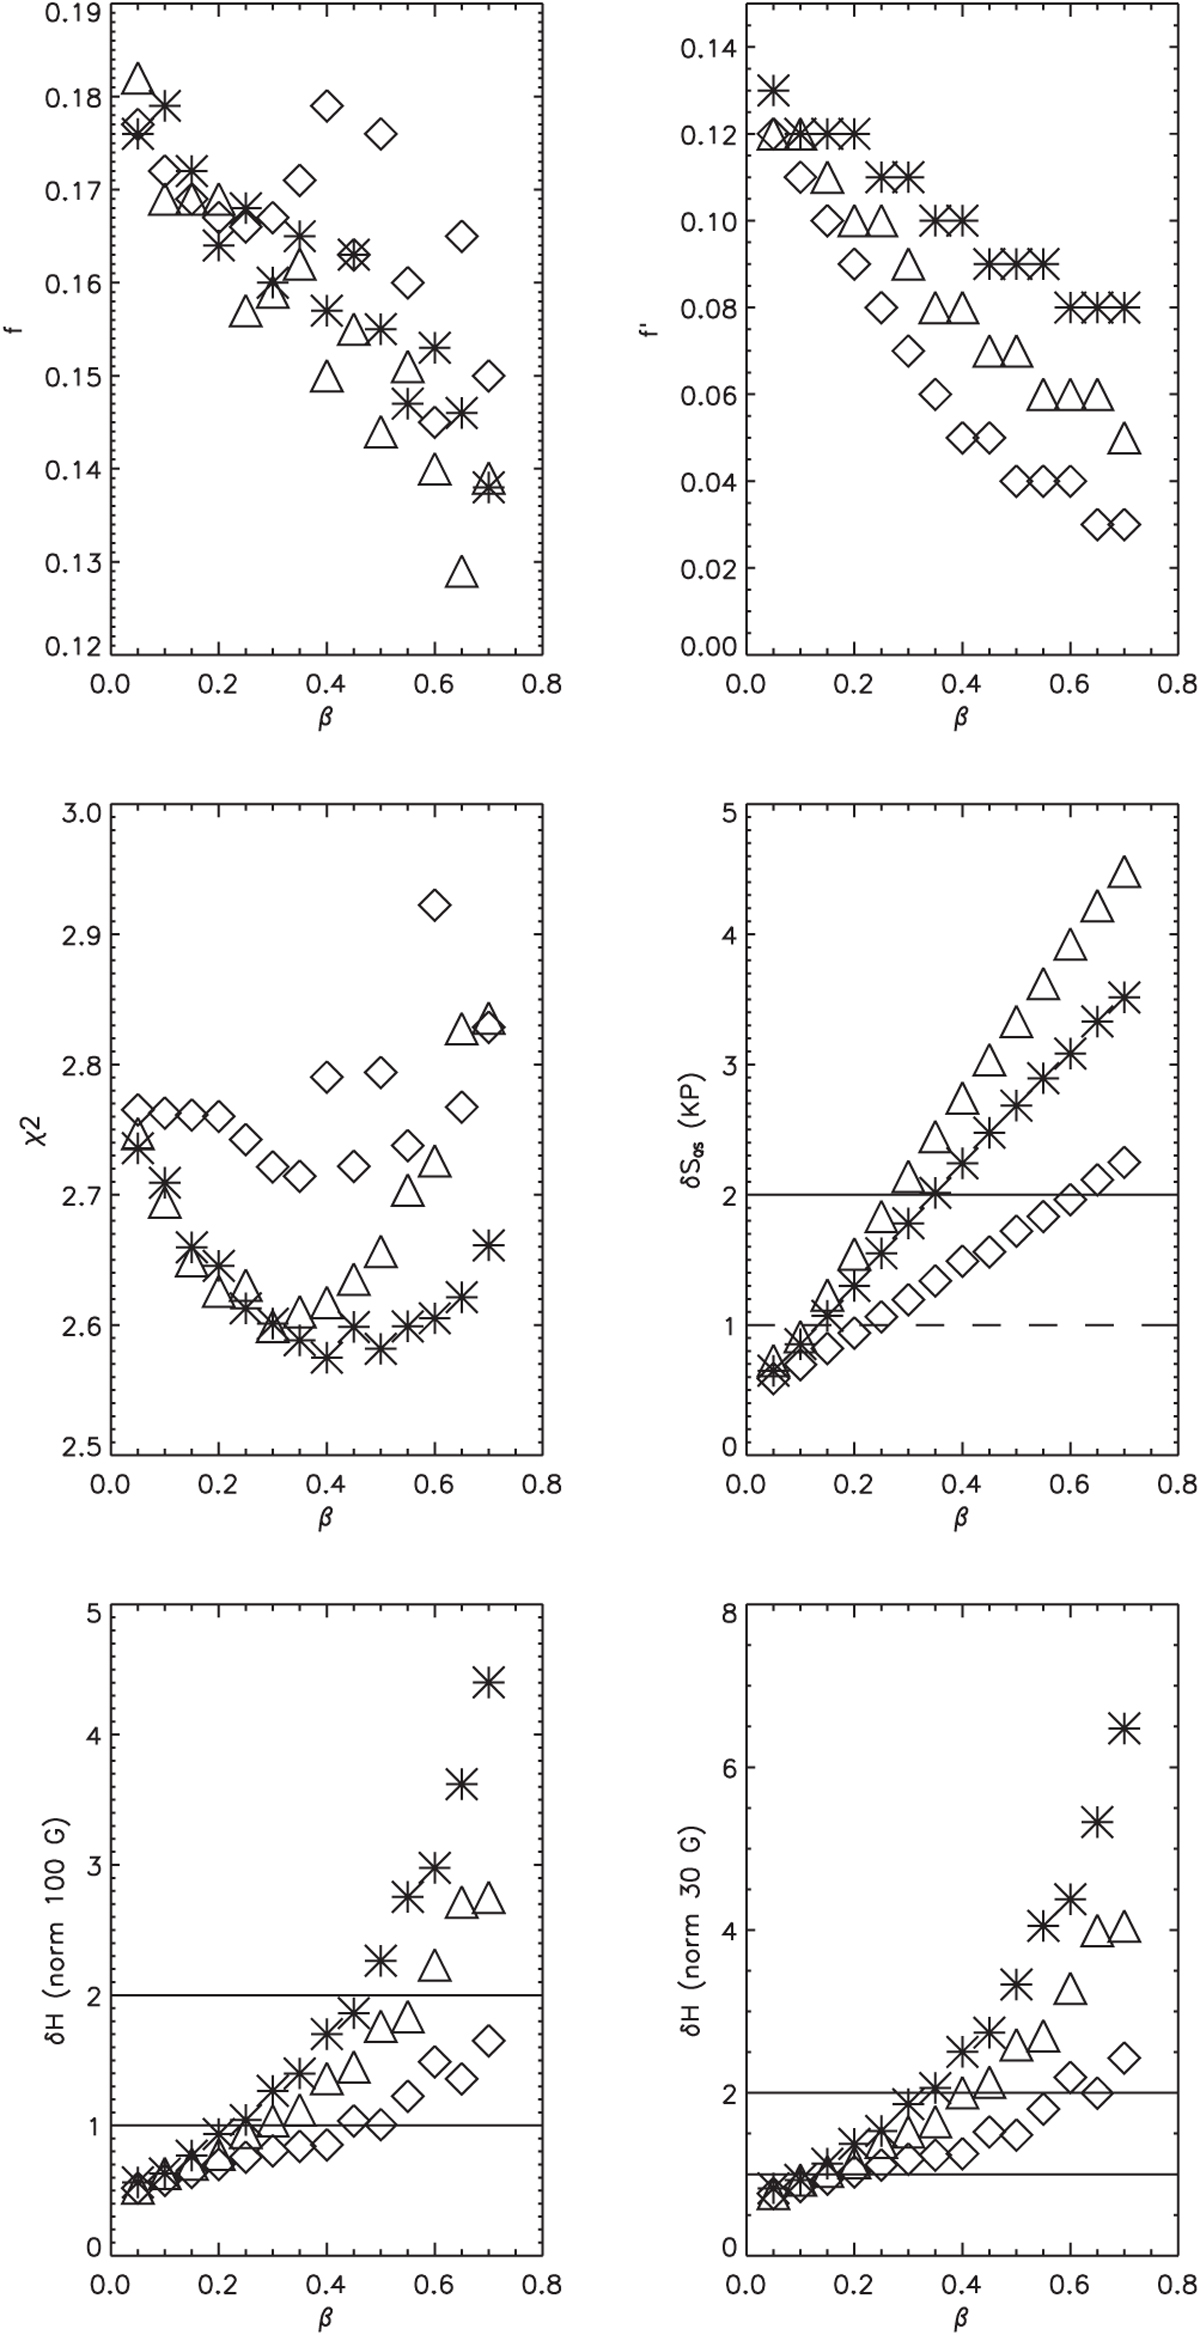
First panel: f vs. β for law 1 (stars), law 2 (diamonds), and law 3 (triangles). Second panel: same for f′ vs. β. Third panel: same for chi2 vs. β. Fourth panel: same for δSQS in 1′ × 3′ quiet box variability (%) vs. β. The horizontal lines highlight the 1 and 2% levels constrained by Kitt Peak observations. Fifth panel: δH (in units used by Rezaei et al. (2007), normalized to match the results from Harvey et al, 1999, at 100 G) vs. β. The horizontal lines highlight H values of 1 and 2, compatible with observations from (Rezaei et al. 2007). Sixth panel: same for a normalization at 30 G.
Current usage metrics show cumulative count of Article Views (full-text article views including HTML views, PDF and ePub downloads, according to the available data) and Abstracts Views on Vision4Press platform.
Data correspond to usage on the plateform after 2015. The current usage metrics is available 48-96 hours after online publication and is updated daily on week days.
Initial download of the metrics may take a while.