Fig. 4
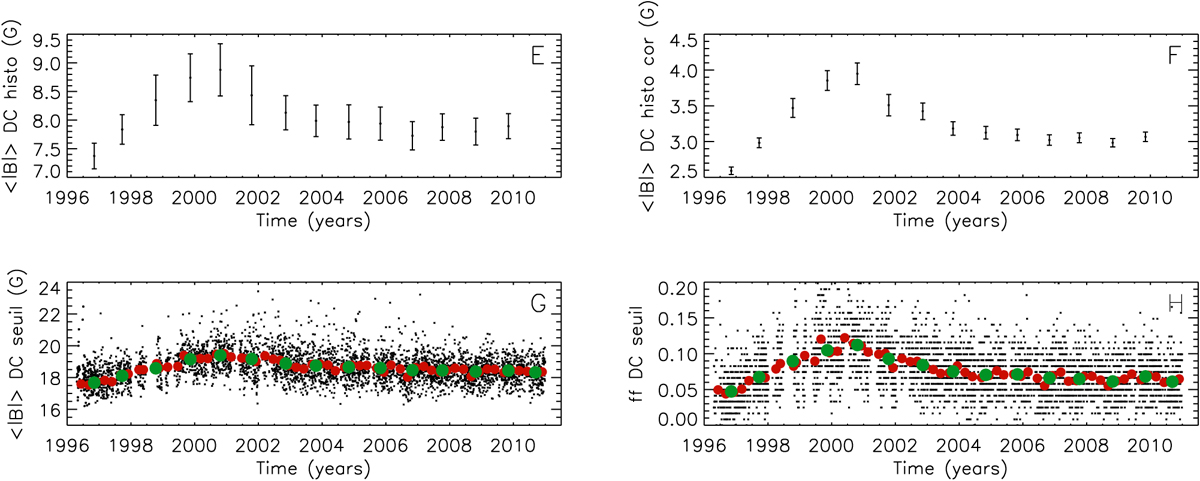
Panel E: <|B|> derived from the maximum of the distribution of the values along the central meridian (within –7° and 7° from disk center) in 11 × 11 pixel boxes. Panel F: same than panel E, but after a correction from the noise. Panel G: same than panel D, but considering only pixels above 1.5 times the noise level. Panel H: fraction of pixels (in the 11 × 11 pixel box) used in panel G.
Current usage metrics show cumulative count of Article Views (full-text article views including HTML views, PDF and ePub downloads, according to the available data) and Abstracts Views on Vision4Press platform.
Data correspond to usage on the plateform after 2015. The current usage metrics is available 48-96 hours after online publication and is updated daily on week days.
Initial download of the metrics may take a while.