Fig. 2
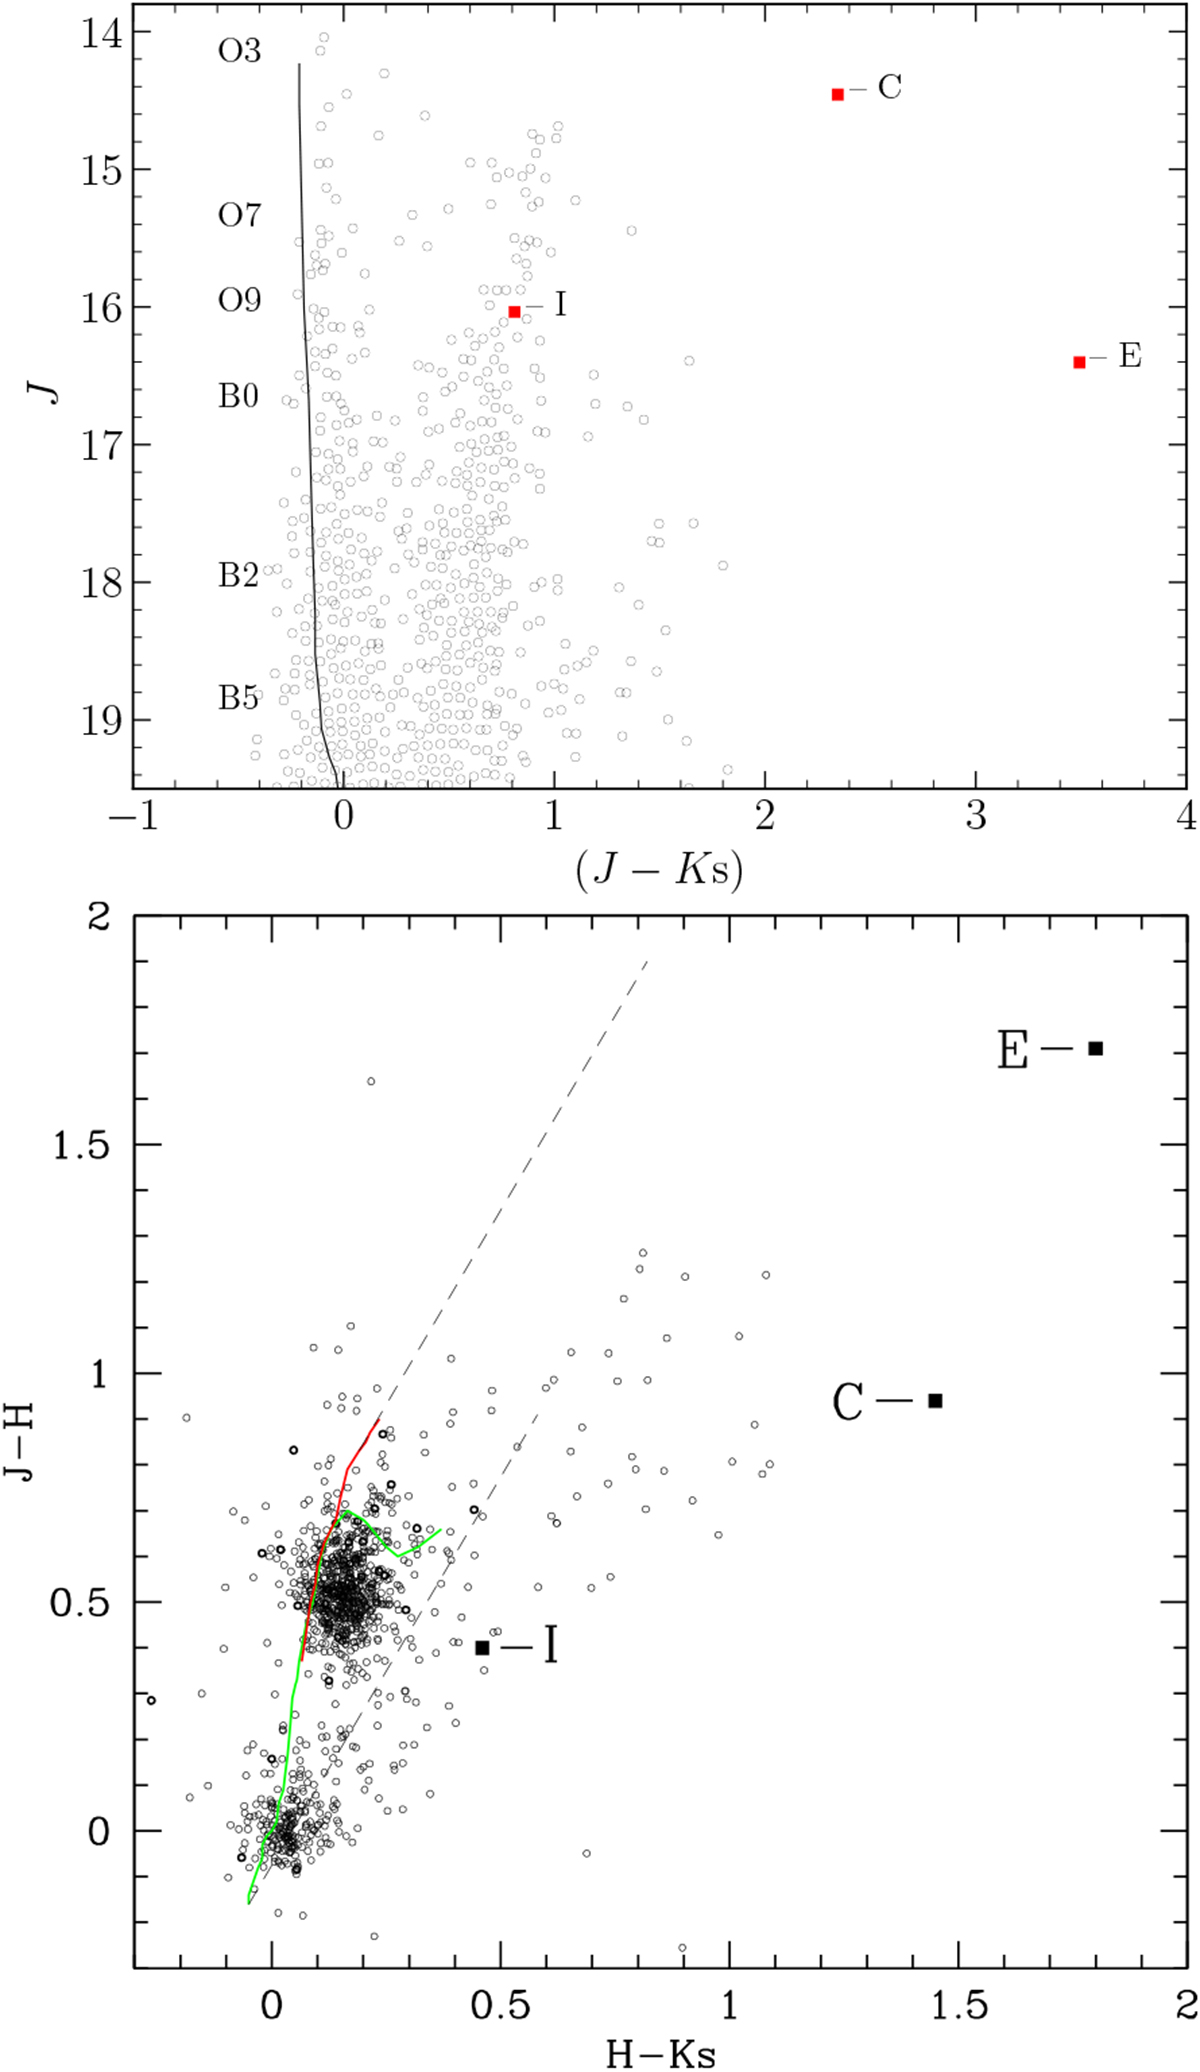
VLT/ISAAC NIR colour–magnitude and colour–colour diagrams of N 66, with the positions of the selected sources for spectroscopy marked. For sources C and E, the Ks magnitudes are from LCO observations. The three sources correspond to the brightest infrared excess sources in their respective molecular clouds. The green and red solid lines in the colour–colour diagram are the dwarf and giant locus respectively.The reddening track of a normal O3 V star and Cool Giant G is plotted as dashed black lines. The ZAMS between B5 and O3 at the distance of the SMC is indicated with a solid black line.
Current usage metrics show cumulative count of Article Views (full-text article views including HTML views, PDF and ePub downloads, according to the available data) and Abstracts Views on Vision4Press platform.
Data correspond to usage on the plateform after 2015. The current usage metrics is available 48-96 hours after online publication and is updated daily on week days.
Initial download of the metrics may take a while.