Fig. 1
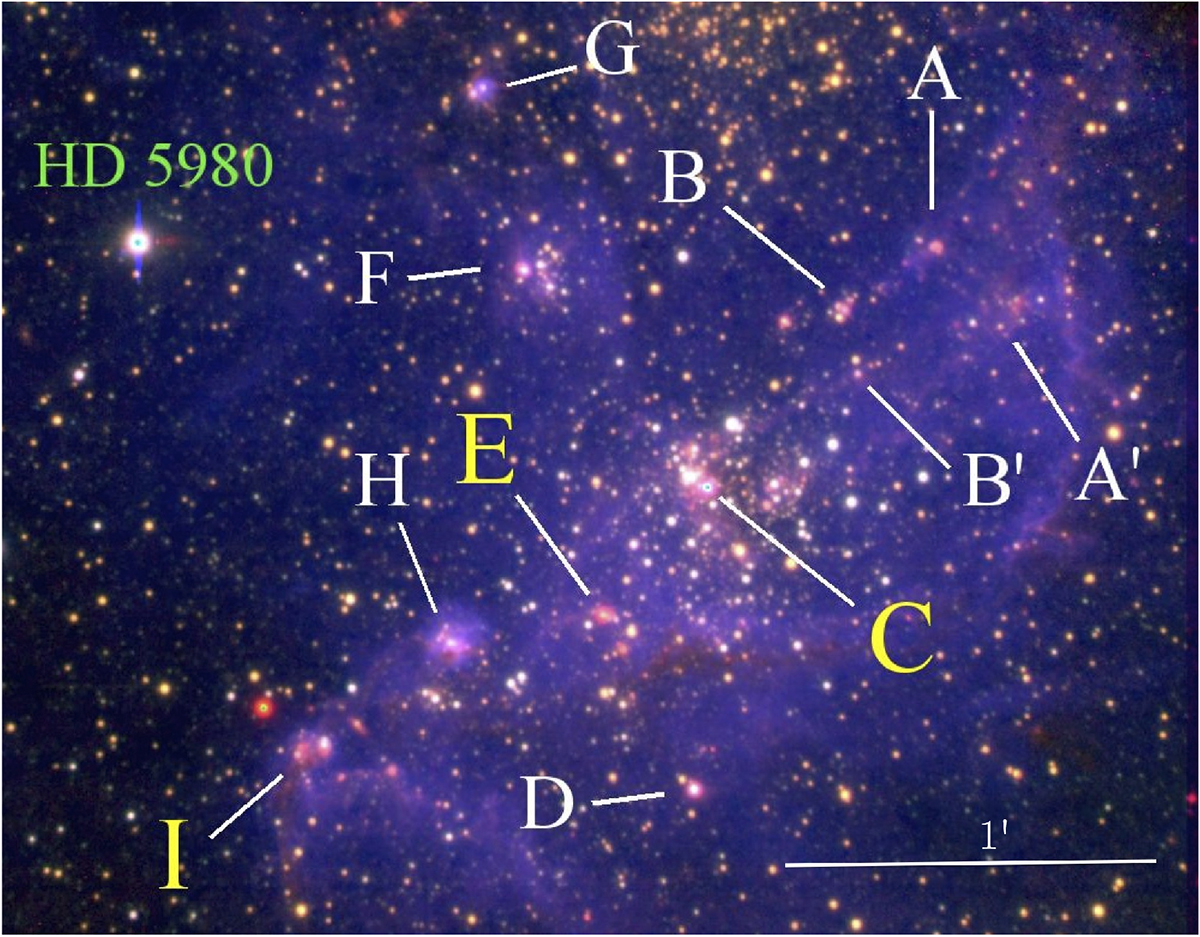
Colour composite image of N 66. In red and green channels are Ks- and J-band images obtained with VLT/ISAAC, respectively. The blue channel is a VLT/FORS1 archival Hα image. Indicated in the images are the ISO sources labelled A to H (Rubio et al. 2000; Contursi et al. 2000). Yellow labels C, E, and I indicate the NIR sources of this study. North is up, and east is to the left. The scale-bar in the lower-left corner gives 1 arcmin.
Current usage metrics show cumulative count of Article Views (full-text article views including HTML views, PDF and ePub downloads, according to the available data) and Abstracts Views on Vision4Press platform.
Data correspond to usage on the plateform after 2015. The current usage metrics is available 48-96 hours after online publication and is updated daily on week days.
Initial download of the metrics may take a while.