Fig. 8
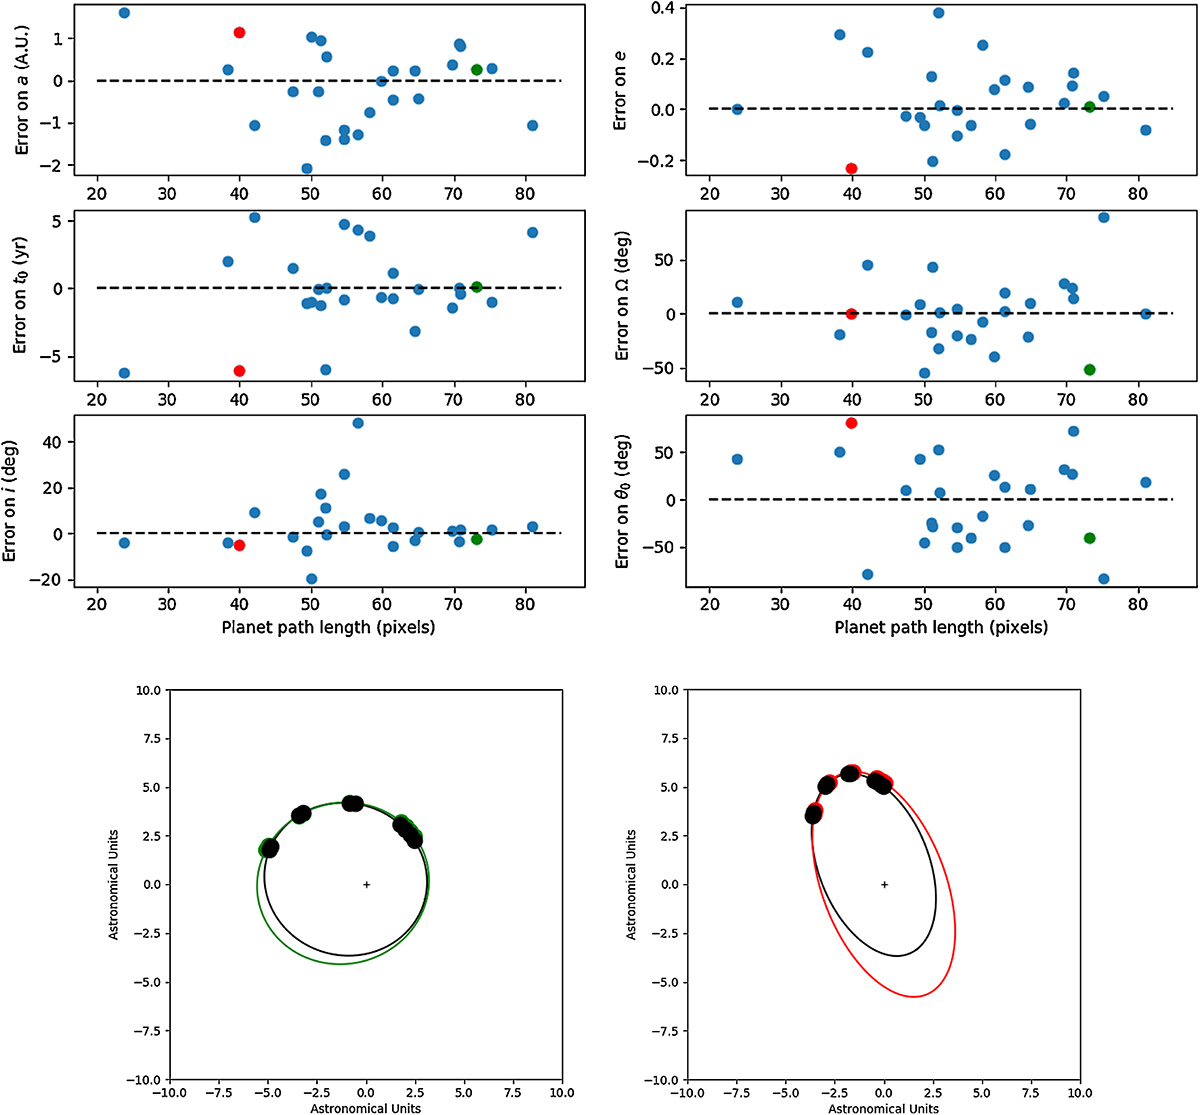
Uppersix panels: errors made on the orbital parameters as a function of the total path travelled by the planet, for each of the simulations in which a planet was correctly identified. In these panels, two cases, corresponding to a good fit (green dots)and a bad fit (red dots) of the orbit are highlighted. Two lower panels: corresponding orbits with the real orbit of the planet in black, and the orbit found by K-Stacker in green (good fit case), and red (bad fit case). For each orbit, the position of the planet in all ten images is also represented.
Current usage metrics show cumulative count of Article Views (full-text article views including HTML views, PDF and ePub downloads, according to the available data) and Abstracts Views on Vision4Press platform.
Data correspond to usage on the plateform after 2015. The current usage metrics is available 48-96 hours after online publication and is updated daily on week days.
Initial download of the metrics may take a while.