Free Access
Fig. 8.
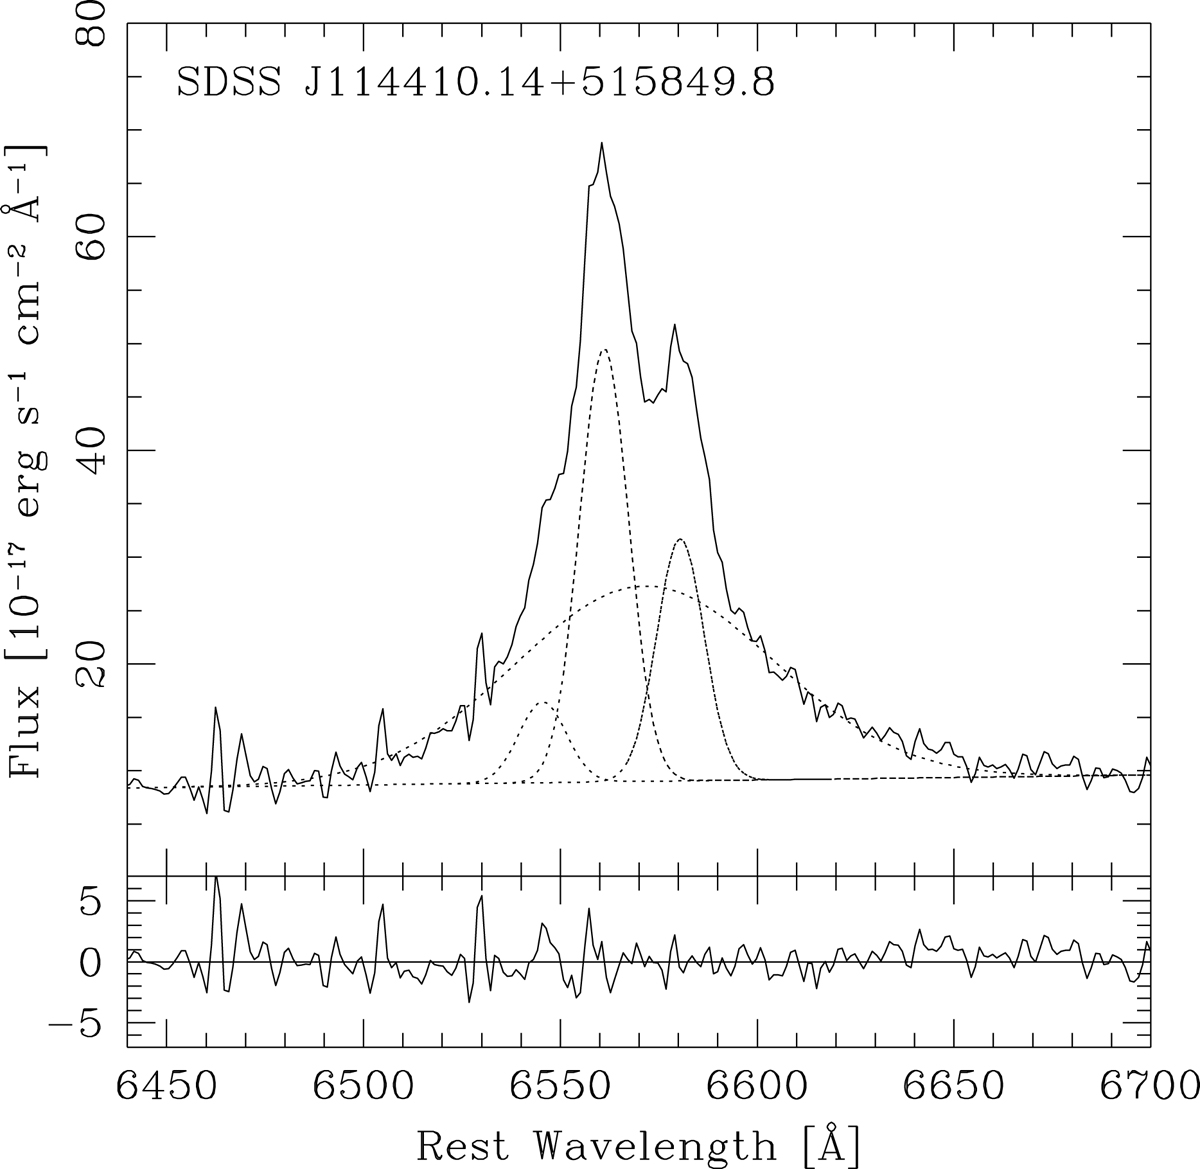
Fit of a typical Hα emission line with the [NII]λλ6548, 6583 lines. The thick black line shows the observed spectrum and the dotted lines display the Gaussian profile decomposition together with, the [NII]λλ6548, 6583 lines. Bottom panel: residuals.
Current usage metrics show cumulative count of Article Views (full-text article views including HTML views, PDF and ePub downloads, according to the available data) and Abstracts Views on Vision4Press platform.
Data correspond to usage on the plateform after 2015. The current usage metrics is available 48-96 hours after online publication and is updated daily on week days.
Initial download of the metrics may take a while.