Fig. 7.
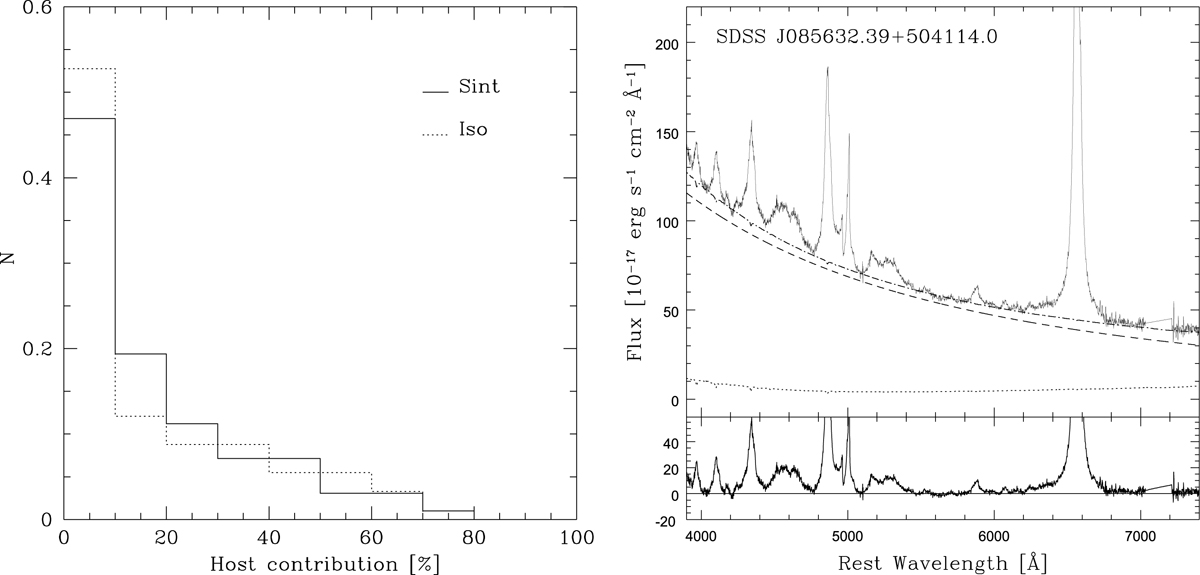
Left panel: normalized distributions of the host contribution for the Sint and Iso sub-samples represented by solid and dashed lines, respectively. Right panel: example of the STARLIGHT fitting of a QSO spectrum. The solid line represents the observed spectrum; dot-short dash line, the synthetic spectrum; short dash line, the AGN contribution in a power-law form, and dotted line, the host contribution (upper panel). Bottom panel: residuals.
Current usage metrics show cumulative count of Article Views (full-text article views including HTML views, PDF and ePub downloads, according to the available data) and Abstracts Views on Vision4Press platform.
Data correspond to usage on the plateform after 2015. The current usage metrics is available 48-96 hours after online publication and is updated daily on week days.
Initial download of the metrics may take a while.