Fig. 8
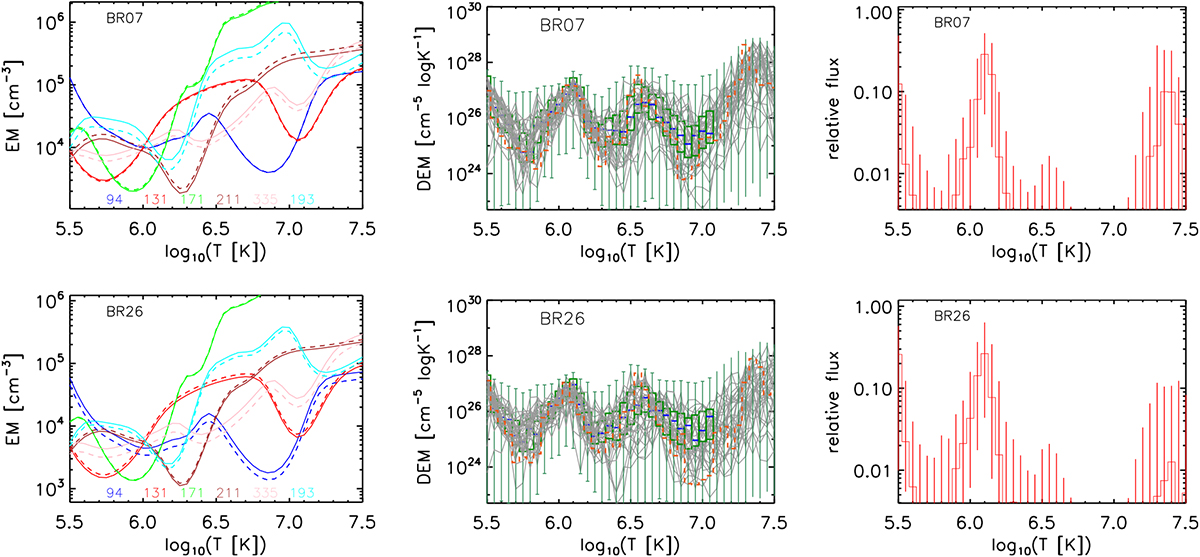
Analysing the thermal structure of brightenings. EM loci curves (left column), DEM distributions (middle column) and an estimate of flux contribution of the DEM at different temperatures (right) are shown for the brightenings Br7 (top row) and Br26 (bottom row). In the DEM plots (middle column), the blue horizontal segments mark the modes of the distribution of DEMs at each temperature bin, the green boxes indicate 50% coverage, and the dashed red line is the nominal best-fit (see text).
Current usage metrics show cumulative count of Article Views (full-text article views including HTML views, PDF and ePub downloads, according to the available data) and Abstracts Views on Vision4Press platform.
Data correspond to usage on the plateform after 2015. The current usage metrics is available 48-96 hours after online publication and is updated daily on week days.
Initial download of the metrics may take a while.