Fig. 5
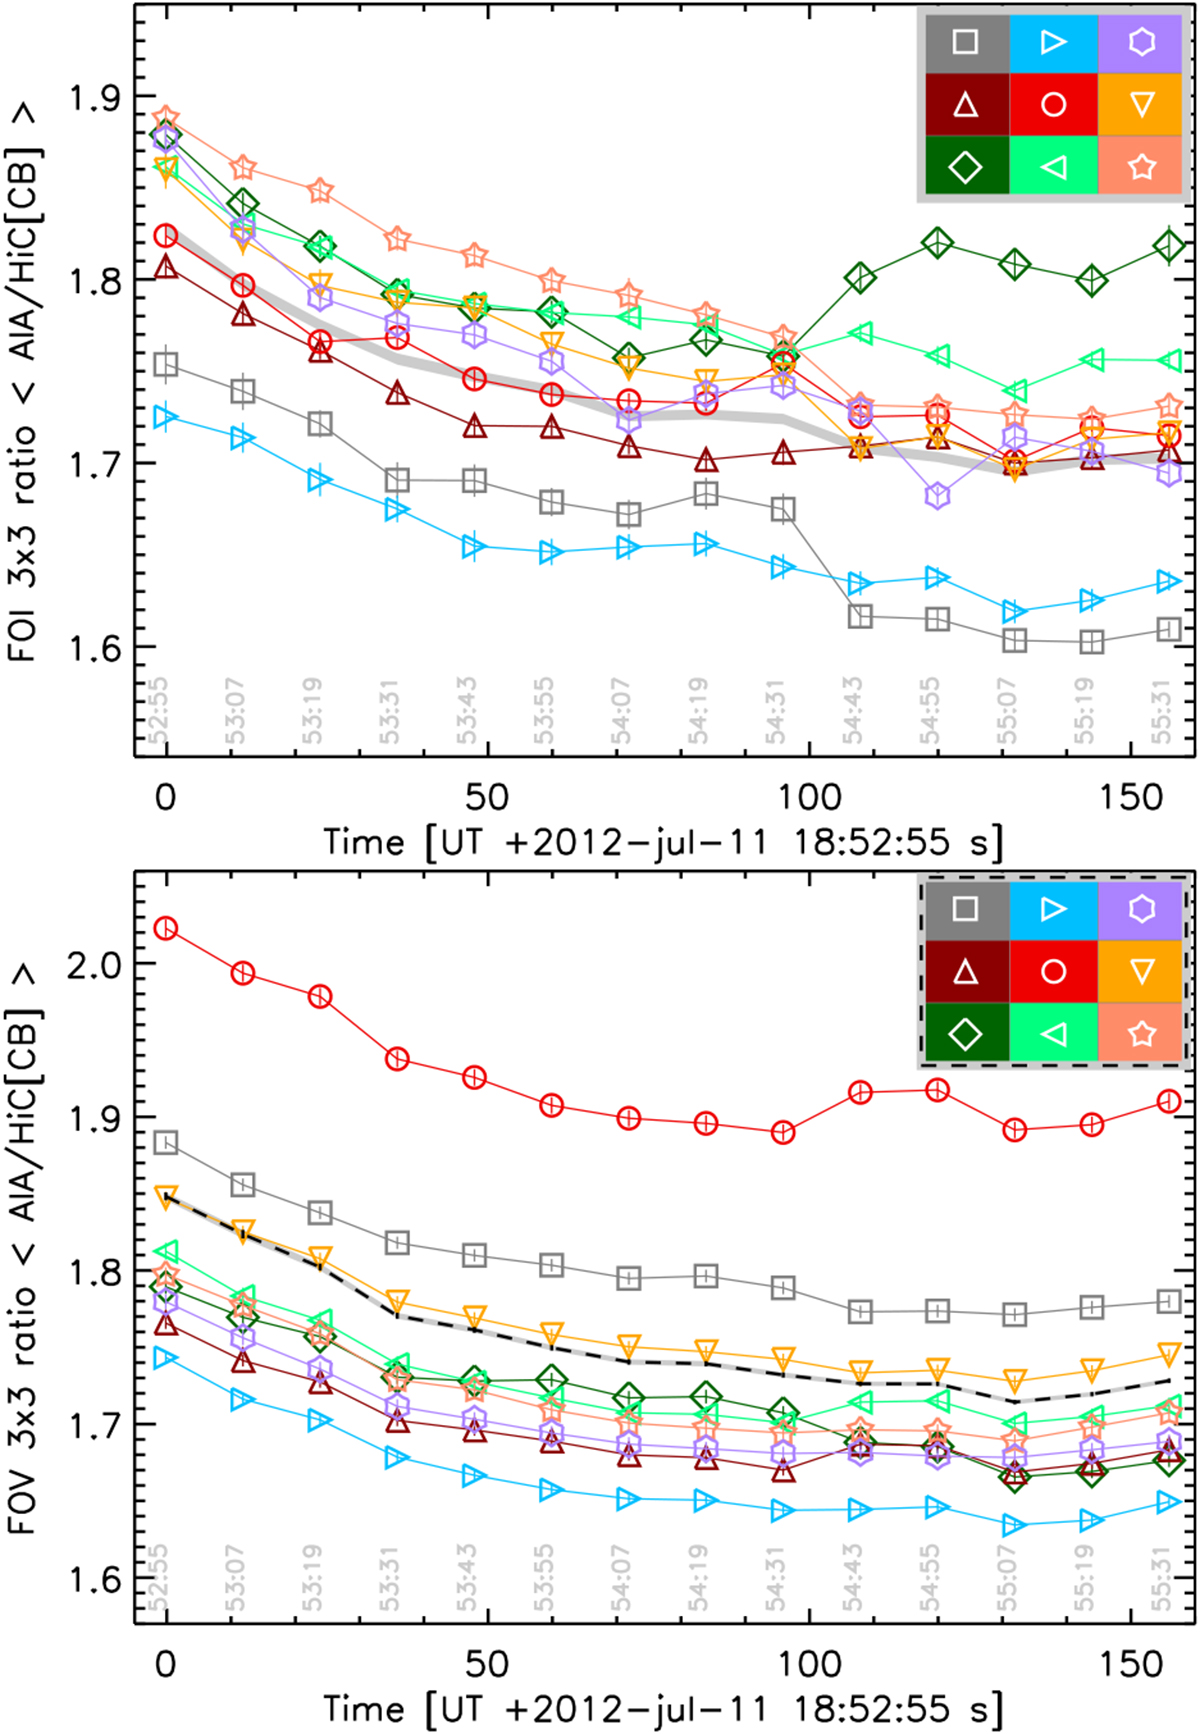
Similar to Fig. 4, for ratios of AIA and Hi-C[CB] intensities averaged over several sub-regions of the Hi-C field of view. The field of interest (FOI; top) and the field of view (FOV; bottom) are split into 3 × 3 equal-area square grids and the pixel-wise ratios of the light curve intensities are averaged over each cell of the grid are shown. Each curve is marked with a colour and symbol corresponding to the cell in the grid as shown in the grid key at top right. In all cases the 1σ standard errors are marked with thin vertical lines. The black dashed line in the bottom plot shows the average of the ratios over the full Hi-C FOV. For comparison, the ratio averaged over the entire FOI from Fig. 4 is shown in the top plot as the grey shaded region.
Current usage metrics show cumulative count of Article Views (full-text article views including HTML views, PDF and ePub downloads, according to the available data) and Abstracts Views on Vision4Press platform.
Data correspond to usage on the plateform after 2015. The current usage metrics is available 48-96 hours after online publication and is updated daily on week days.
Initial download of the metrics may take a while.