Fig. 4
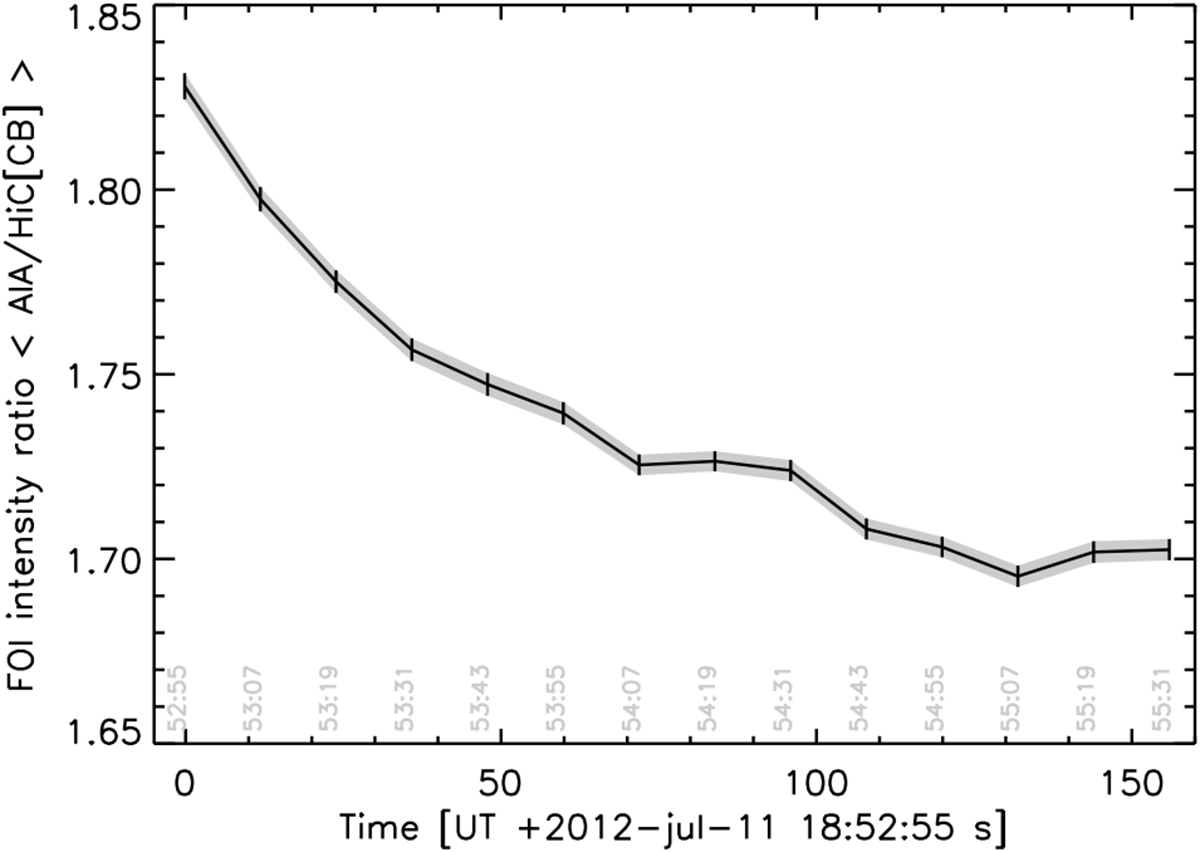
Characterizing the temporal changes between Hi-C and AIA. Ratio of intensities of AIA and comparable Hi-C convolved and binned (Hi-C [CB]) images, spatially averaged over the field of interest (FOI). 1σ standard errors are marked as vertical bars, and the dark grey shaded region represents the error envelope. The ratios are calculated at the time epochs of the AIA observations (time stamps marked in light grey along the abscissa), using the Hi-C observation nearest in time to it. A systematic decrease of ≈ 8% over the duration of the Hi-C observation is clearly visible in the data.
Current usage metrics show cumulative count of Article Views (full-text article views including HTML views, PDF and ePub downloads, according to the available data) and Abstracts Views on Vision4Press platform.
Data correspond to usage on the plateform after 2015. The current usage metrics is available 48-96 hours after online publication and is updated daily on week days.
Initial download of the metrics may take a while.