Free Access
Fig. C.1
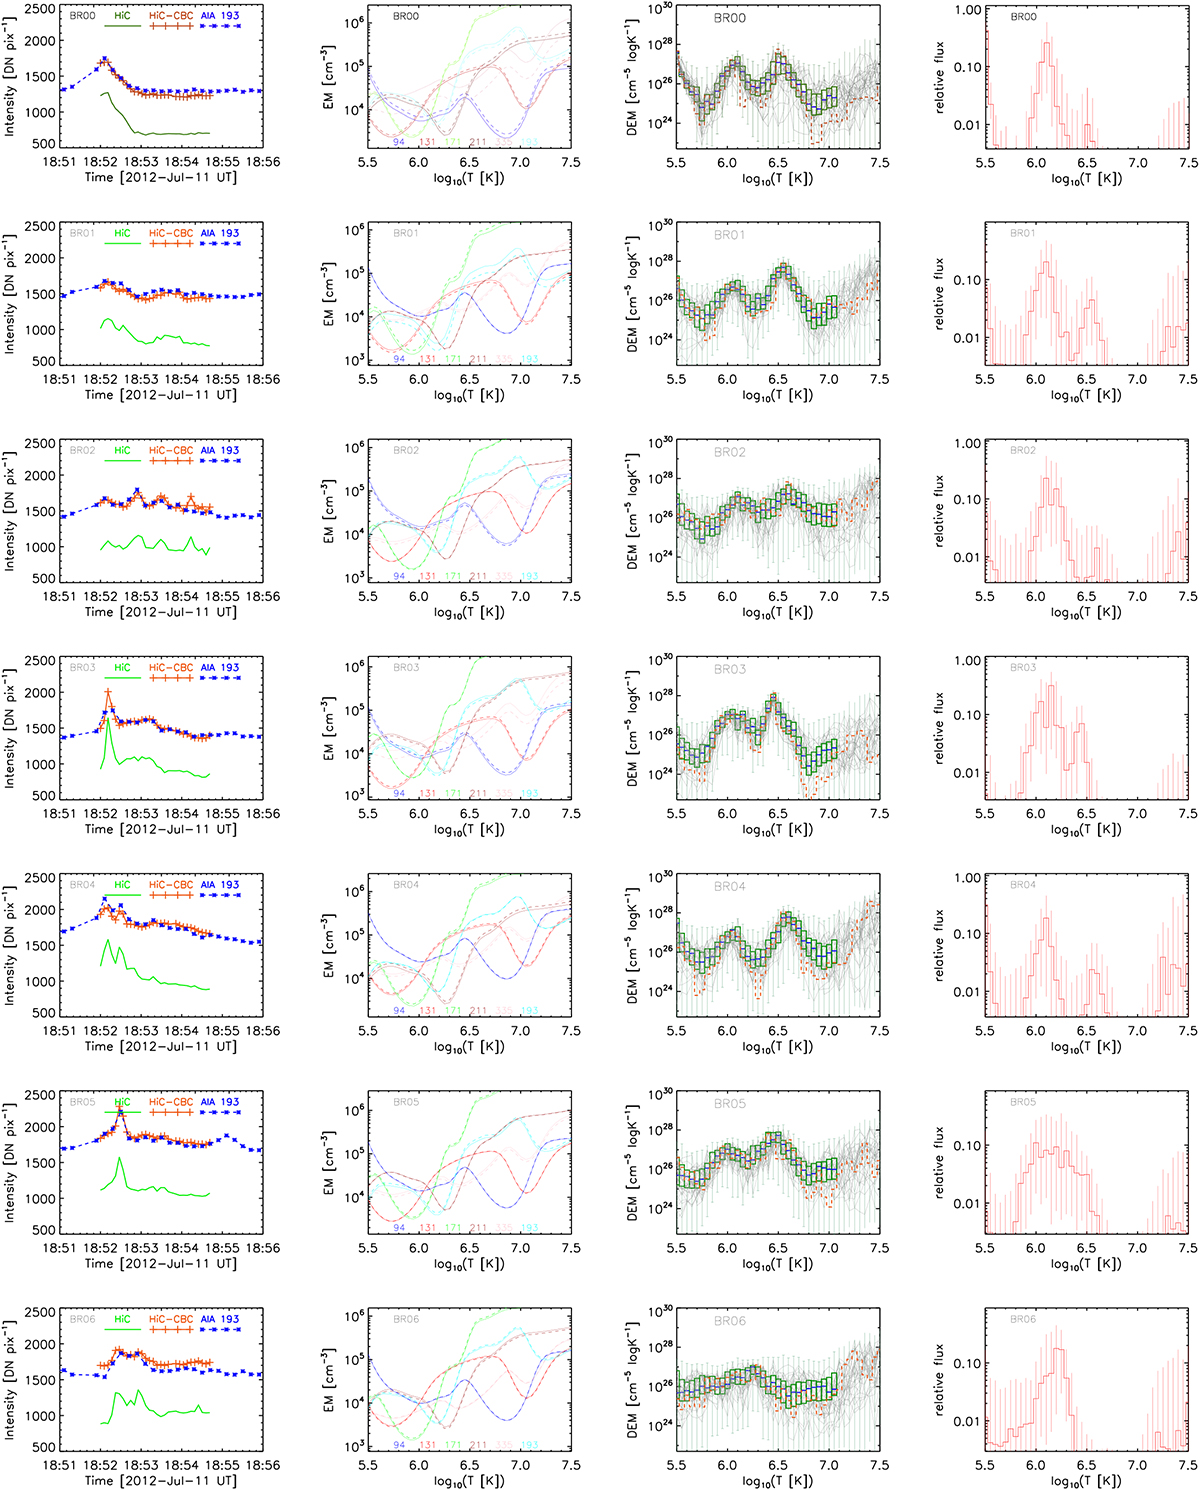
From left to right: light curves (panel 1), EM loci curves (panel 2), DEM reconstructions (panel 3), and contributions of different temperatures to flux in AIA 193 Å (panel 4), for each of the brighhtenings studied here (excluding Br07 and Br26).
Current usage metrics show cumulative count of Article Views (full-text article views including HTML views, PDF and ePub downloads, according to the available data) and Abstracts Views on Vision4Press platform.
Data correspond to usage on the plateform after 2015. The current usage metrics is available 48-96 hours after online publication and is updated daily on week days.
Initial download of the metrics may take a while.