Fig. 8
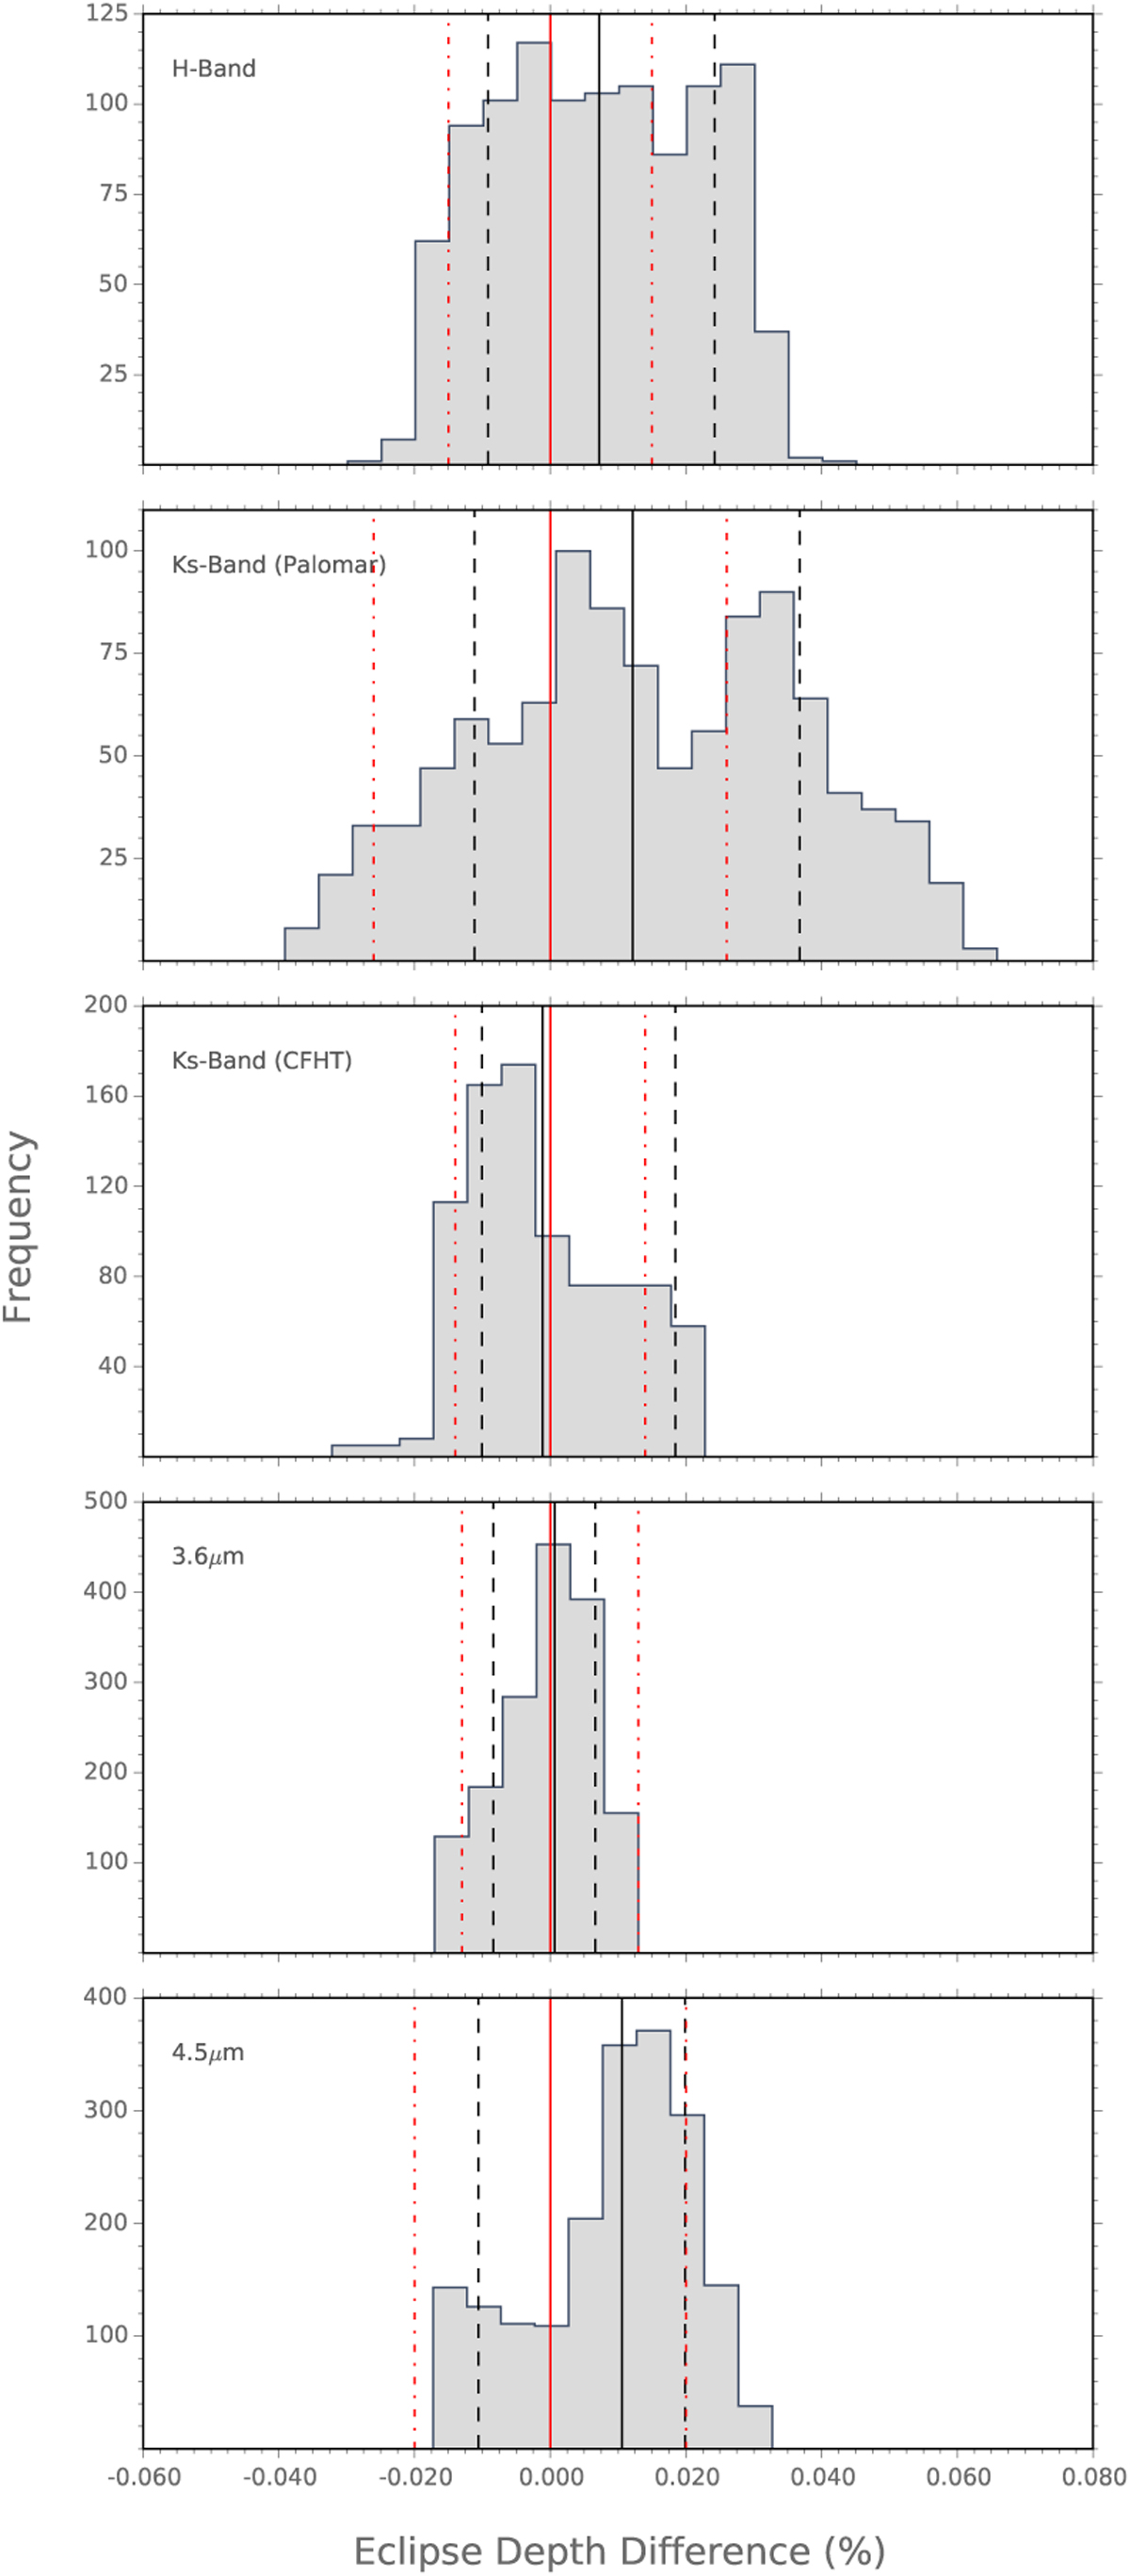
Distributions of occultation depth produced by the residual permutations method. In each case, the value from the final MCMCs (solid red line) has been subtracted; the dashed red lines are the MCMC 1σ limits. The solid and the dashed black lines are the medians and the 1σ confidence intervals of the residual-permutations distributions.
Current usage metrics show cumulative count of Article Views (full-text article views including HTML views, PDF and ePub downloads, according to the available data) and Abstracts Views on Vision4Press platform.
Data correspond to usage on the plateform after 2015. The current usage metrics is available 48-96 hours after online publication and is updated daily on week days.
Initial download of the metrics may take a while.