Free Access
Fig. 5
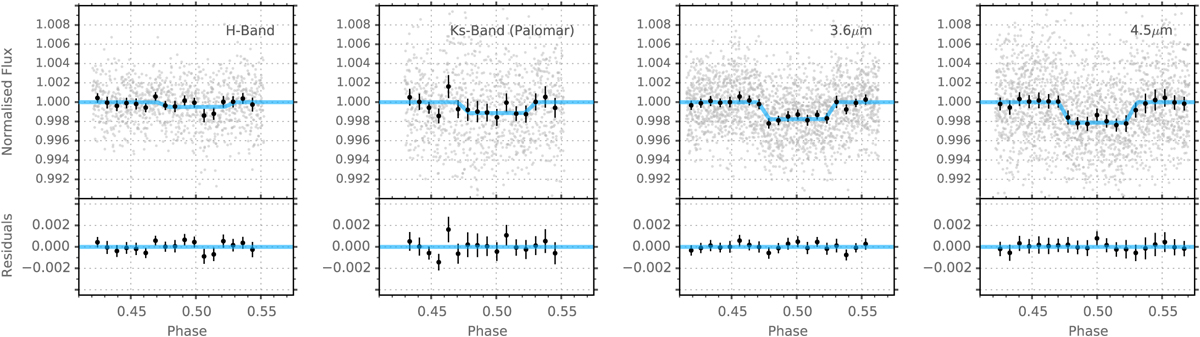
Occultation lightcurves from O’Rourke et al. (2014), detrended as described in Sect. 3.3. The best-fitting occultation models from our global MCMC analysis are plotted in blue. The black points with error bars show the data binned in 20 min intervals. Bottom row: binned residuals about the fits.
Current usage metrics show cumulative count of Article Views (full-text article views including HTML views, PDF and ePub downloads, according to the available data) and Abstracts Views on Vision4Press platform.
Data correspond to usage on the plateform after 2015. The current usage metrics is available 48-96 hours after online publication and is updated daily on week days.
Initial download of the metrics may take a while.