Fig. 2
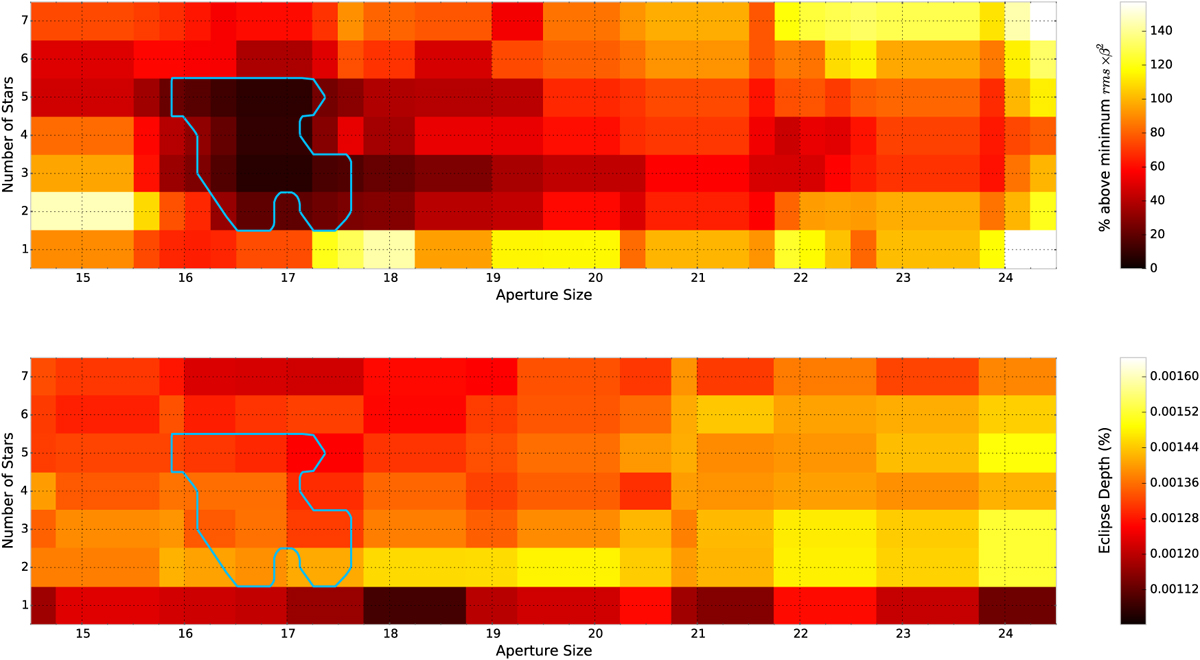
Top: percentage of RMS × β2 above the minimum value shown as a function of aperture size and the number of included reference stars. Bottom: percentage eclipse depth as a function of aperture size and number of reference stars. In both cases, the blue contours indicate the region that contains all values less than 15% above the minimum RMS × β2.
Current usage metrics show cumulative count of Article Views (full-text article views including HTML views, PDF and ePub downloads, according to the available data) and Abstracts Views on Vision4Press platform.
Data correspond to usage on the plateform after 2015. The current usage metrics is available 48-96 hours after online publication and is updated daily on week days.
Initial download of the metrics may take a while.