Fig. 4.
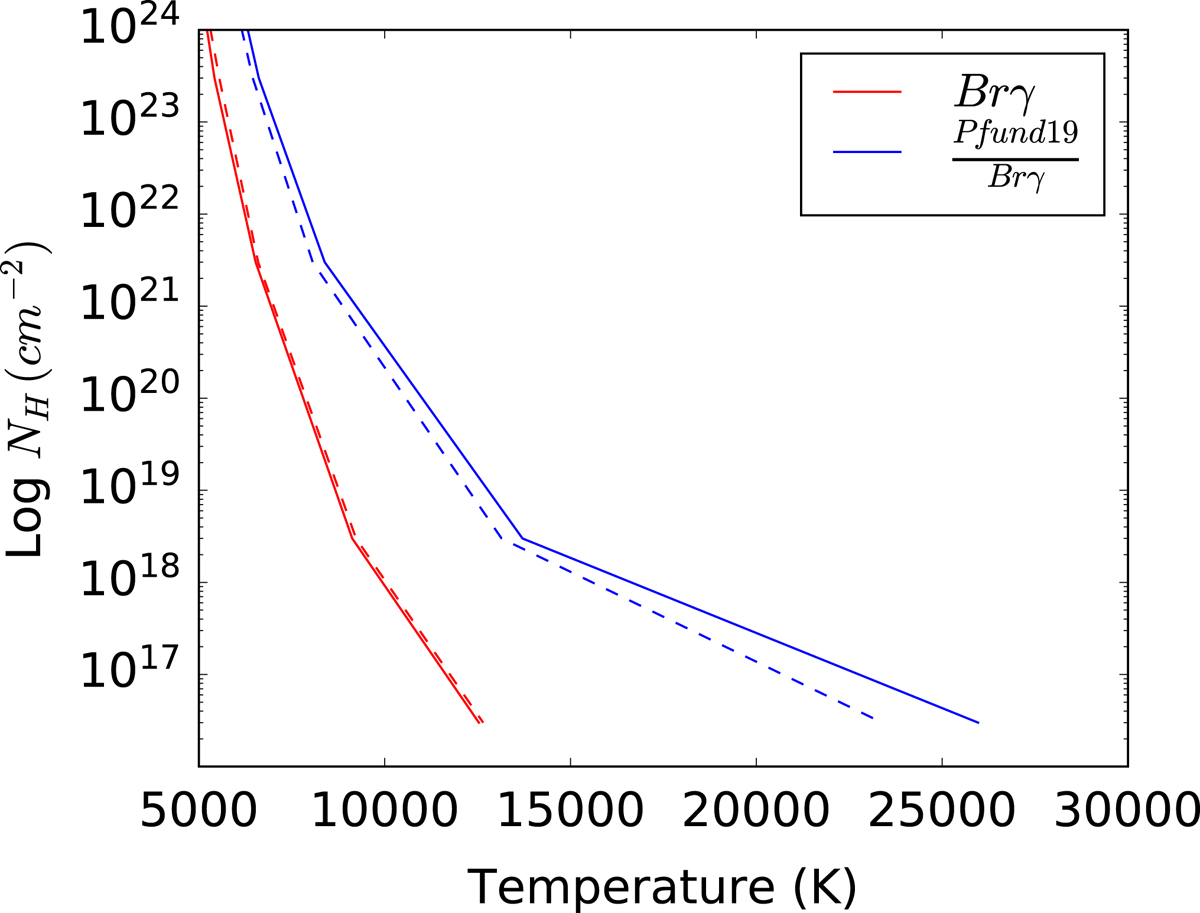
Locus of the column density of neutral hydrogen (N H) and temperature (T) that best reproduce the fluxes of Brγ and the Pfund 19 (Table 3). The red solid line is for Brγ while the blue solid line represents the ratio of the Pfund 19 over the Brγ. The dashed lines are the 3σ uncertainties plotted only from one side. The ratios of the other Pfund lines are not plotted because they are very similar to that for Pfund 19.
Current usage metrics show cumulative count of Article Views (full-text article views including HTML views, PDF and ePub downloads, according to the available data) and Abstracts Views on Vision4Press platform.
Data correspond to usage on the plateform after 2015. The current usage metrics is available 48-96 hours after online publication and is updated daily on week days.
Initial download of the metrics may take a while.