Fig. 3.
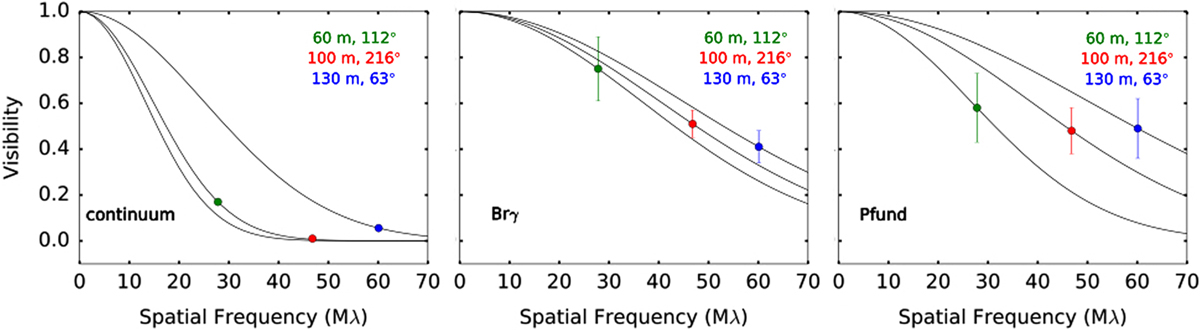
Single 2D Gaussian fitting of visibility versus spatial frequency, for the continuum, Brγ line and Pfund lines, respectively. Each point was fitted individually, and a size was estimated from the HWHM, Table 5. Above, left panel: continuum visibilities corrected for the stellar contribution. The errors are too small to be seen in the plot; middle panel: Brγ pure line visibilities; right panel: averaged Pfund visibilities.
Current usage metrics show cumulative count of Article Views (full-text article views including HTML views, PDF and ePub downloads, according to the available data) and Abstracts Views on Vision4Press platform.
Data correspond to usage on the plateform after 2015. The current usage metrics is available 48-96 hours after online publication and is updated daily on week days.
Initial download of the metrics may take a while.