Fig. 2.
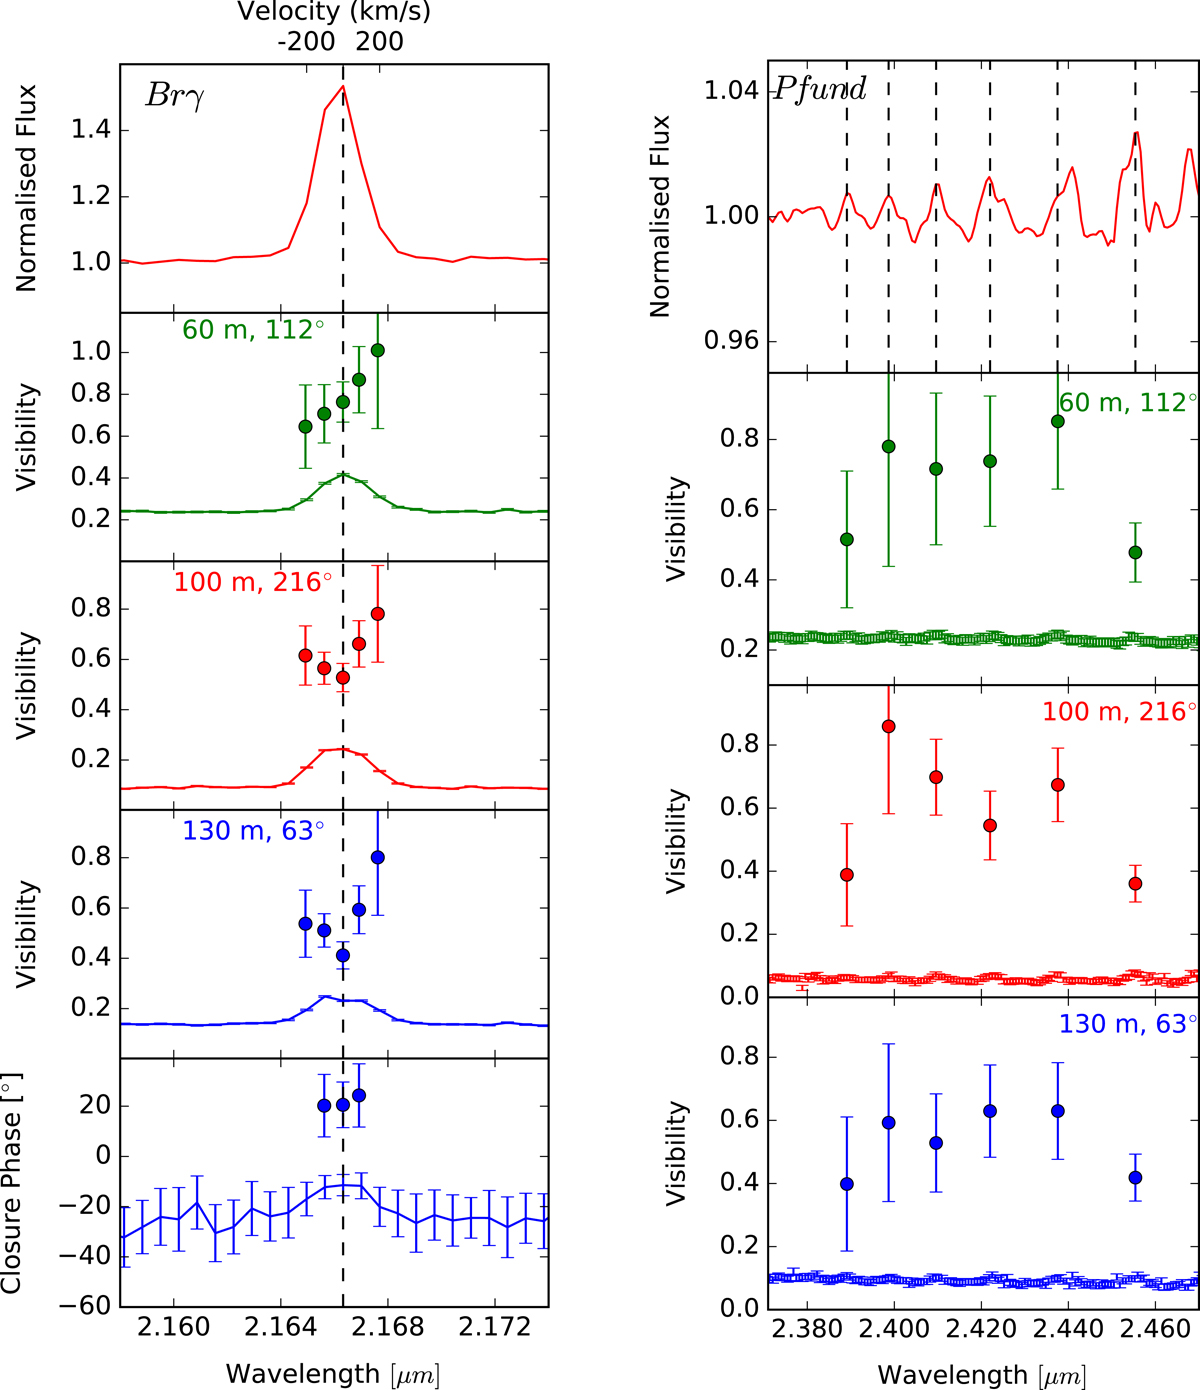
Spectrum, and pure line visibilities for each baseline observation of the Brγ line (left) and high-n Pfund lines (right). The dashed lines correspond to the systemic velocities of the lines. For clarity, the dashed lines were removed for the Pfund visibility plots. The visibilities of Fig. 1 are overplotted, for comparison. The continuum-corrected closure phase for the Brγ line is also plotted, and accompanied by an overplot of the closure phase of Fig. 1. No offset in closure phase for Pfund was detected in Fig. 1, and so no plot is made here of the continuum-corrected closure phase for Pfund.
Current usage metrics show cumulative count of Article Views (full-text article views including HTML views, PDF and ePub downloads, according to the available data) and Abstracts Views on Vision4Press platform.
Data correspond to usage on the plateform after 2015. The current usage metrics is available 48-96 hours after online publication and is updated daily on week days.
Initial download of the metrics may take a while.