Fig. 1
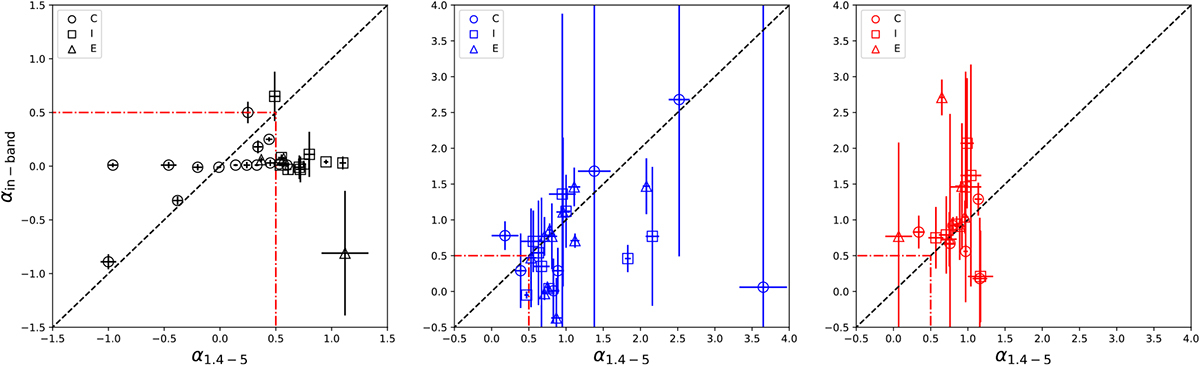
Spectral index between 1.4 and 5 GHz vs. in-band spectral index at 5 GHz. From the left, F sample, Q sample, and S sample. The colors indicate the classification, from left to right: black is for F objects, blue for the Q sample, and red for the S sources. Circles indicate compact sources, squares intermediate sources and triangles extended sources. The dashed black line indicates the 1:1 ratio, the dashed-dotted red lines separate the region of flat-spectrum sources (α < 0.5) from that ofsteep-spectrum objects.
Current usage metrics show cumulative count of Article Views (full-text article views including HTML views, PDF and ePub downloads, according to the available data) and Abstracts Views on Vision4Press platform.
Data correspond to usage on the plateform after 2015. The current usage metrics is available 48-96 hours after online publication and is updated daily on week days.
Initial download of the metrics may take a while.