Fig. 4
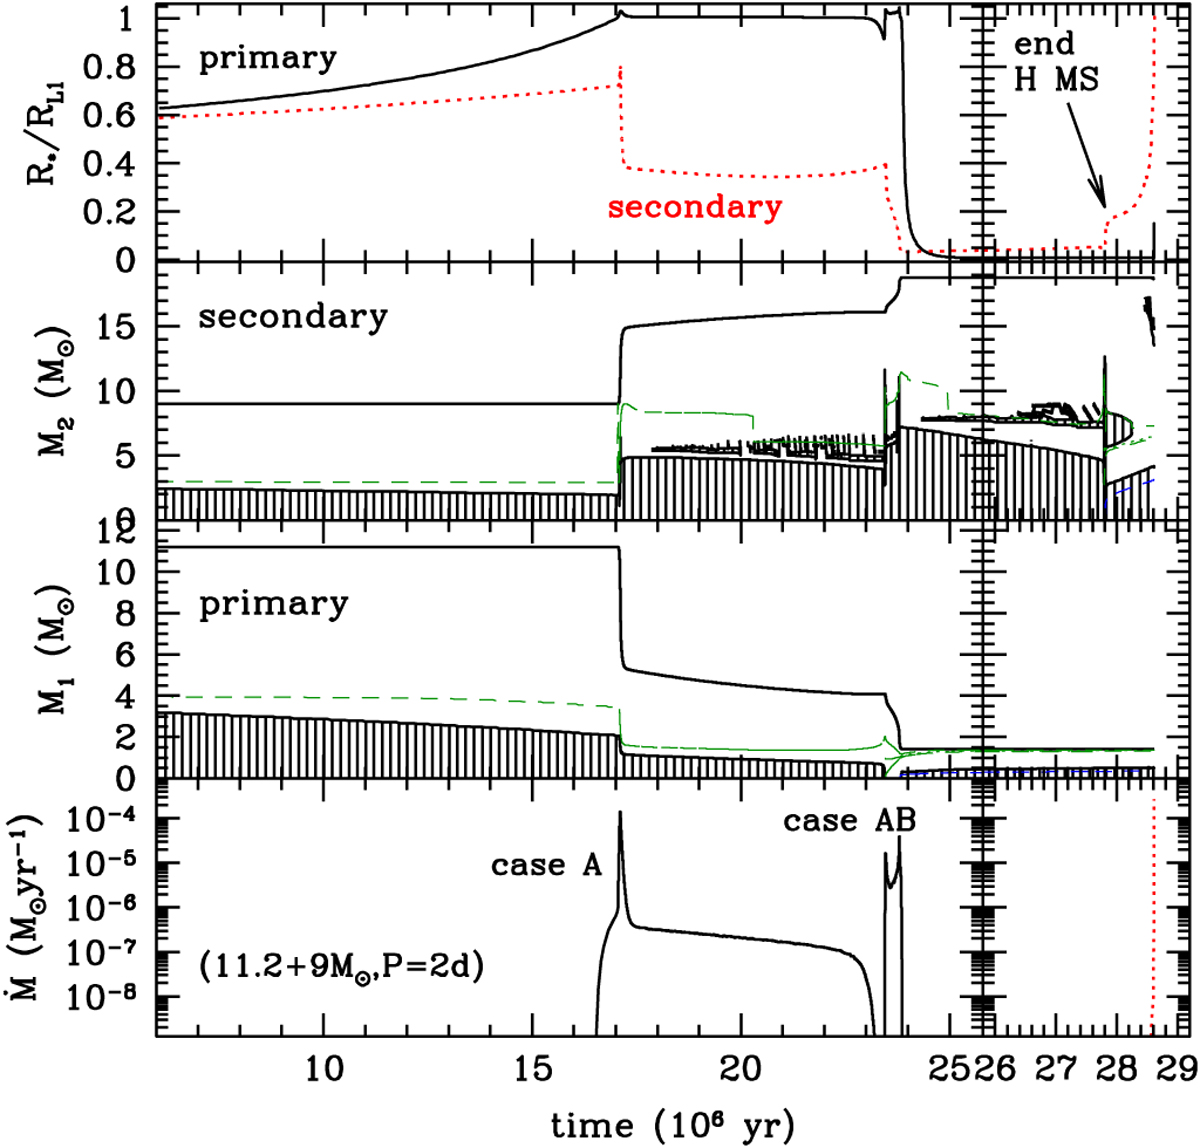
Evolutionary properties of a representative 11.2 + 9 M⊙, two-day case A system. From top to bottom: overfilling factor (ratio of the stellar to Roche radius), Kippenhahn diagrams of the secondary and of the primary, and Roche lobe overflow mass transfer rate. The red dotted lines in the top and bottom panels refer to the secondary.
Current usage metrics show cumulative count of Article Views (full-text article views including HTML views, PDF and ePub downloads, according to the available data) and Abstracts Views on Vision4Press platform.
Data correspond to usage on the plateform after 2015. The current usage metrics is available 48-96 hours after online publication and is updated daily on week days.
Initial download of the metrics may take a while.