Free Access
Fig. A.1
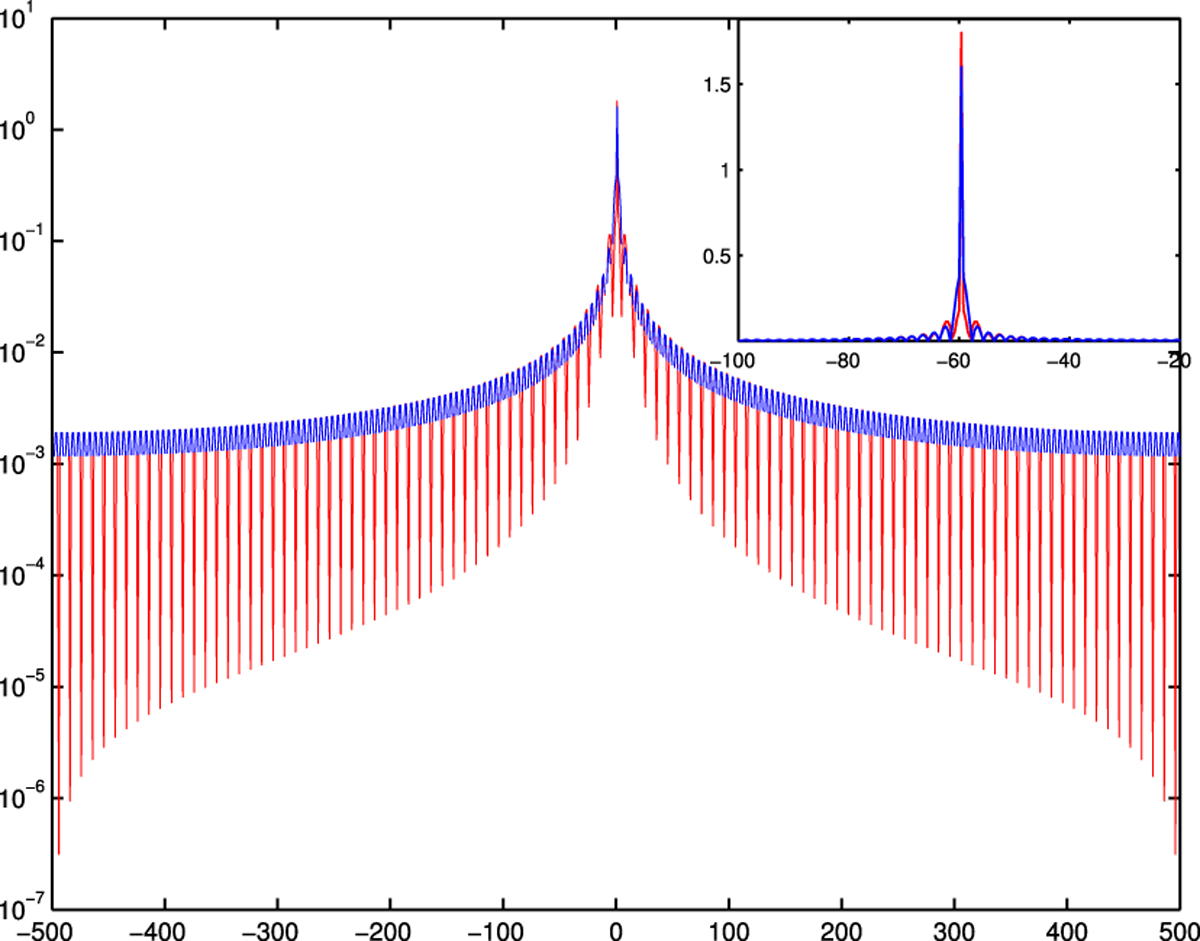
Spectral response function in log scale associated to gapped data (in blue) and linearly interpolated data (in red). See the inset for a zoom of the central peak in linear scale.
Current usage metrics show cumulative count of Article Views (full-text article views including HTML views, PDF and ePub downloads, according to the available data) and Abstracts Views on Vision4Press platform.
Data correspond to usage on the plateform after 2015. The current usage metrics is available 48-96 hours after online publication and is updated daily on week days.
Initial download of the metrics may take a while.