Free Access
Fig. 2
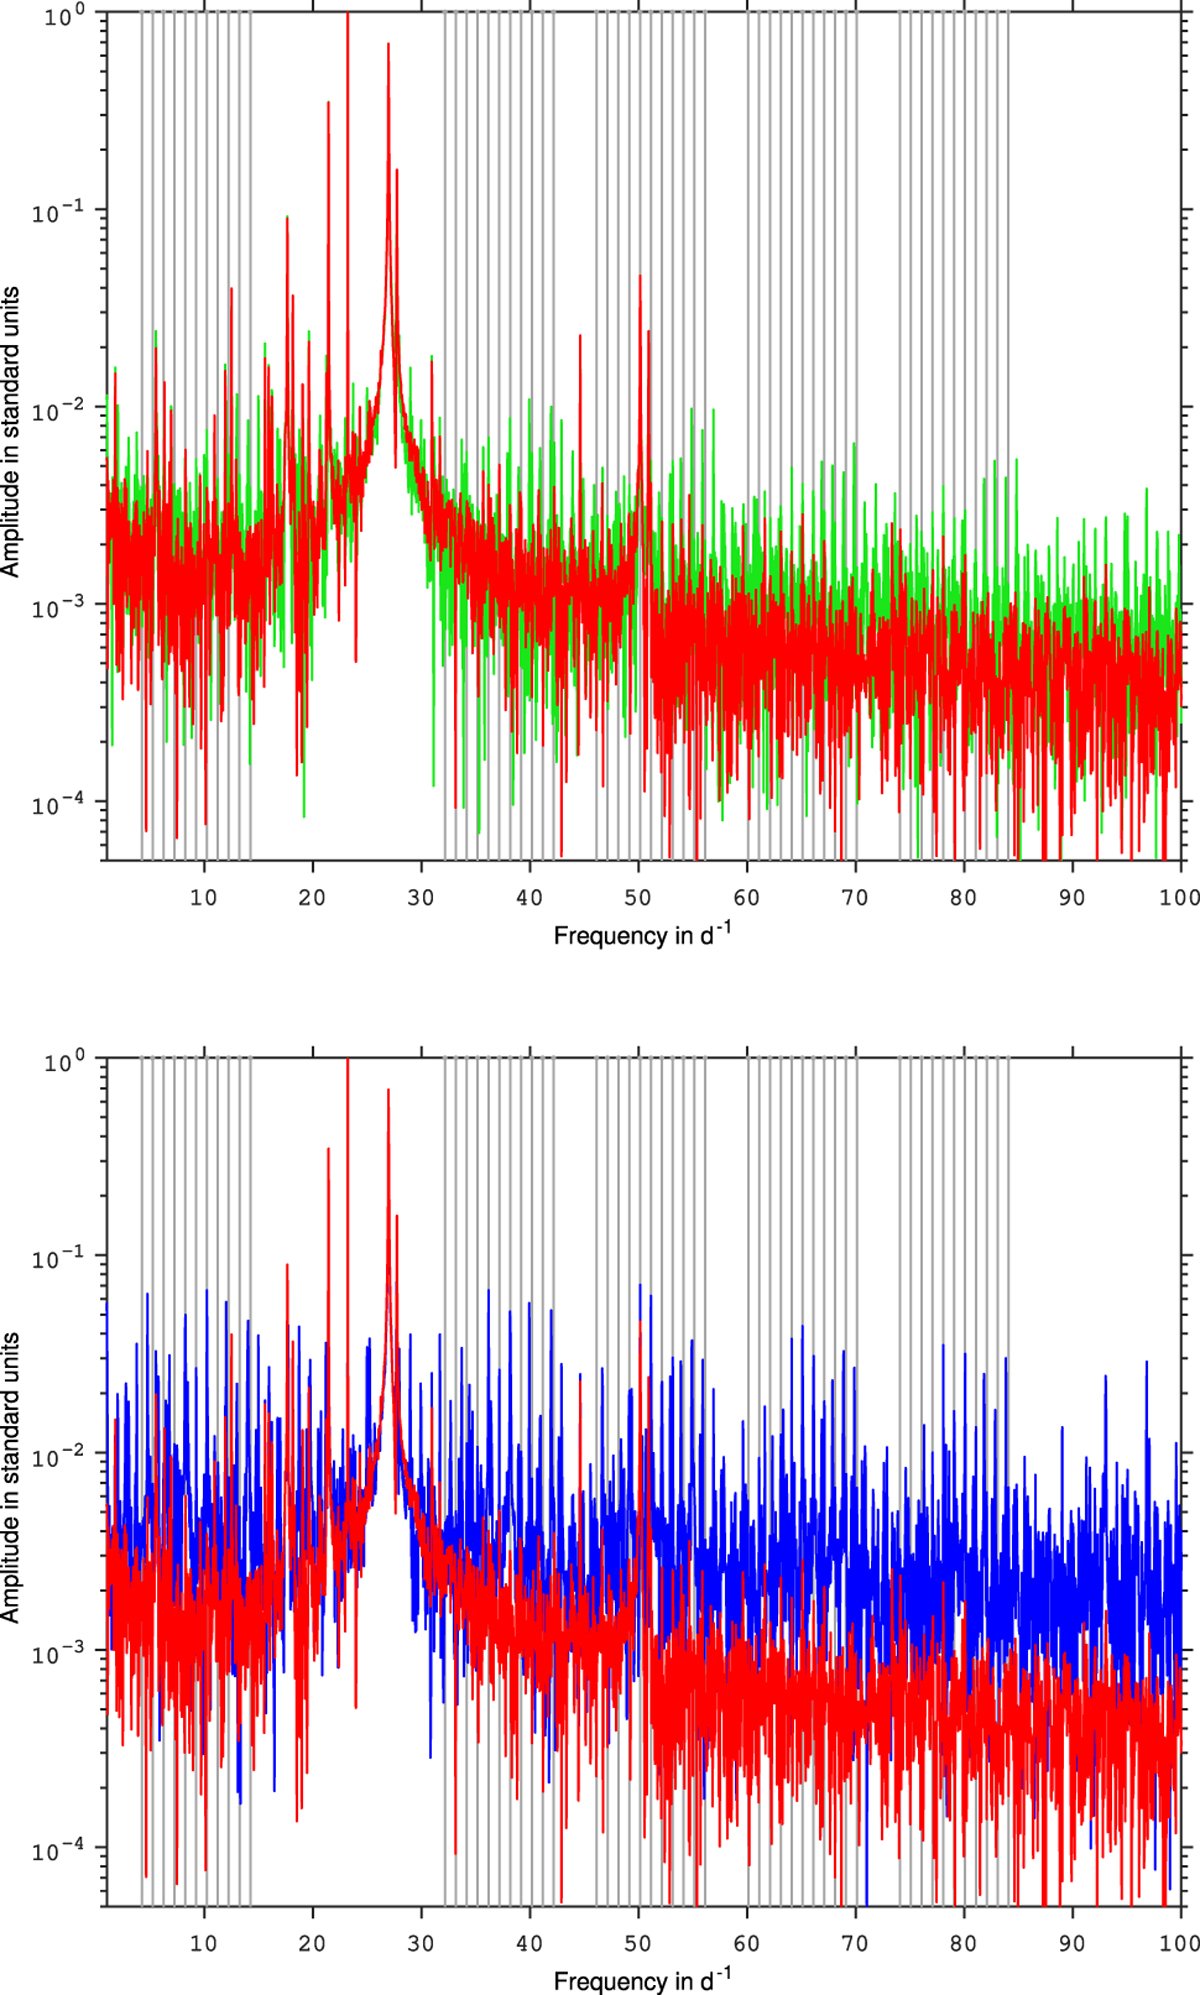
Powerspectra of the light curves from HD 174966: lower panel shows gapped data in blue and ARMA-interpolated data in red,upper panel shows linearly interpolated data in green and ARMA-interpolated data in red. Vertical gray lines show the main peaks of the spectral window.
Current usage metrics show cumulative count of Article Views (full-text article views including HTML views, PDF and ePub downloads, according to the available data) and Abstracts Views on Vision4Press platform.
Data correspond to usage on the plateform after 2015. The current usage metrics is available 48-96 hours after online publication and is updated daily on week days.
Initial download of the metrics may take a while.