Free Access
Fig. 9
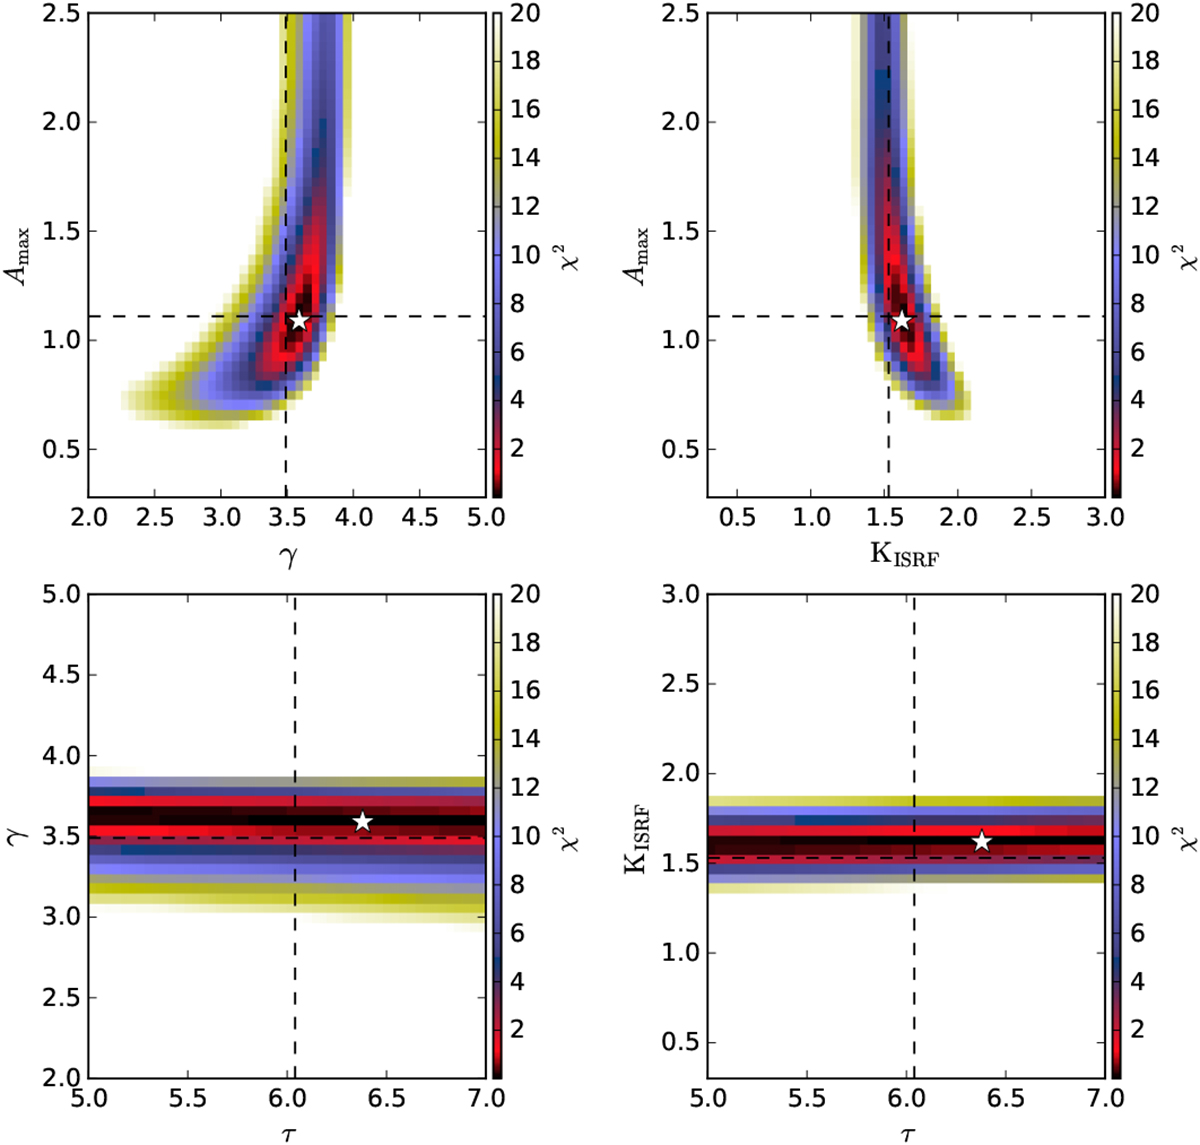
Cross sections of the χ2 distribution through the location of the χ2 minimum for the synthetic observations. The white star indicates the χ2 minimum and the dashed lines show the dust parameter values used to simulate the synthetic observations. The colour bars correspond to the χ2 distribution.
Current usage metrics show cumulative count of Article Views (full-text article views including HTML views, PDF and ePub downloads, according to the available data) and Abstracts Views on Vision4Press platform.
Data correspond to usage on the plateform after 2015. The current usage metrics is available 48-96 hours after online publication and is updated daily on week days.
Initial download of the metrics may take a while.