Free Access
Fig. 6
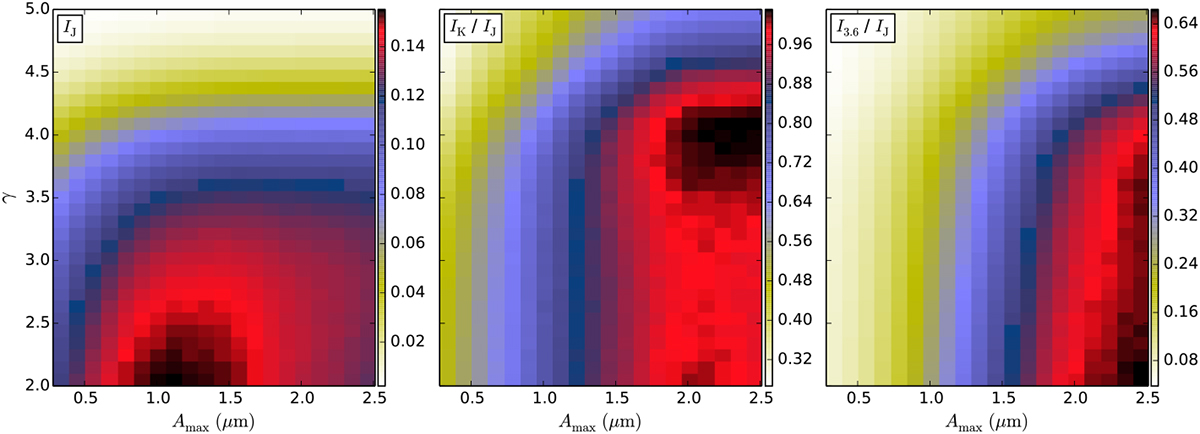
Left: intensity of the J band as a function of γ and Amax. Centre and right: the intensity ratios of the K to the J band, and of the 3.6 μm to the J band, respectively. A one-dimensional model is used with rSi = 0.5 and τJ = 6. The colour bars show the intensity and intensity ratios.
Current usage metrics show cumulative count of Article Views (full-text article views including HTML views, PDF and ePub downloads, according to the available data) and Abstracts Views on Vision4Press platform.
Data correspond to usage on the plateform after 2015. The current usage metrics is available 48-96 hours after online publication and is updated daily on week days.
Initial download of the metrics may take a while.