Fig. C.1
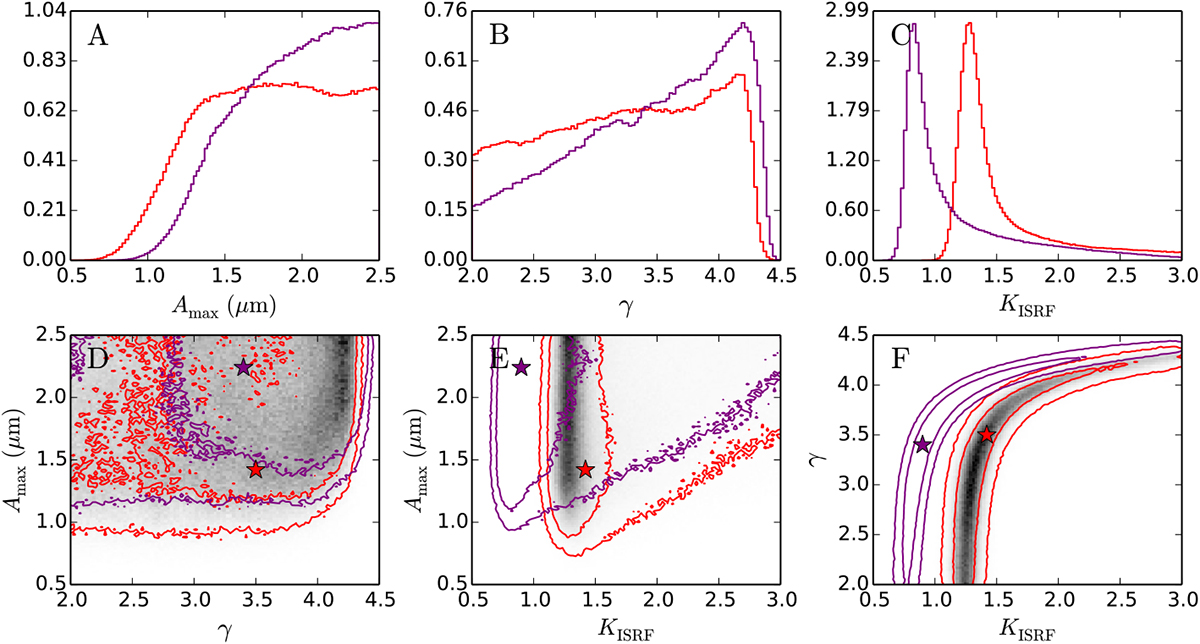
Marginalised probability distributions of dust parameters for the TMC-1N τJ = 6 position. The grain albedo in the radiative transfer calculations is changed by −10% (red lines) or +10% (purple lines), compare to Fig. 15. For the surface brightness data σNIR = 20% is assumed. The stars indicate the projected positions of the χ2 minima. The greyscale map corresponds to the red lines and the contours show 1σ and 2σ.
Current usage metrics show cumulative count of Article Views (full-text article views including HTML views, PDF and ePub downloads, according to the available data) and Abstracts Views on Vision4Press platform.
Data correspond to usage on the plateform after 2015. The current usage metrics is available 48-96 hours after online publication and is updated daily on week days.
Initial download of the metrics may take a while.