Fig. A.1
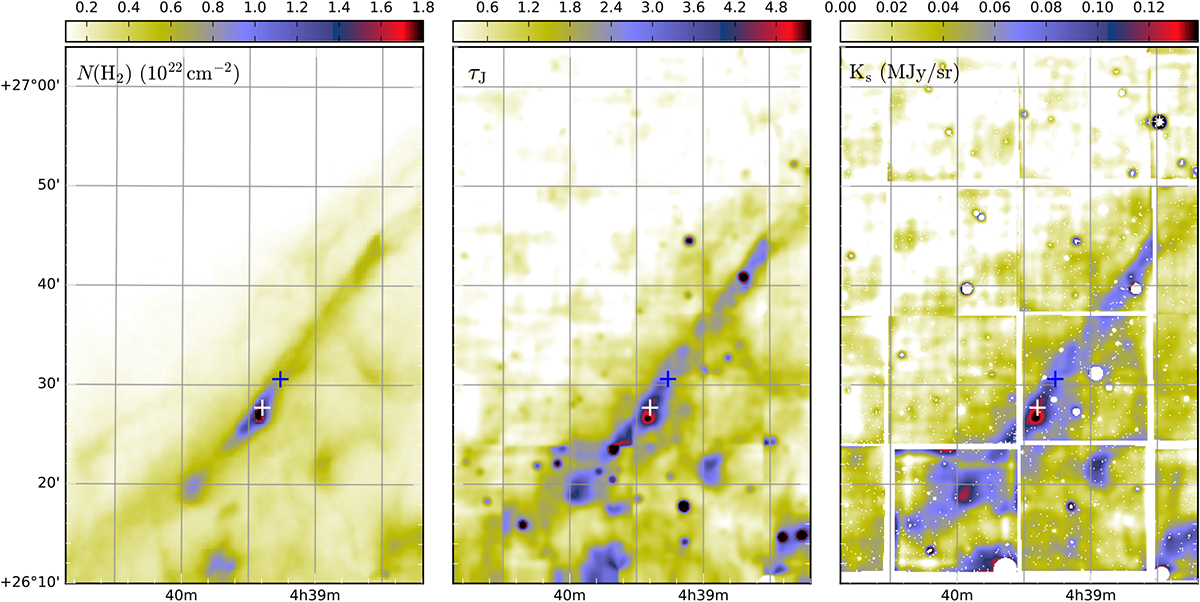
0.6° × 0.6° hydrogen column density map derived from the Herschel data (left), and the optical-depth map derived using the surface brightness of the scattered light (centre); right; a Ks band intensity map (MJy sr−1; Malinen et al. 2013). The positions used to represent the filament in the CRT and MCMC simulations are shown with a white plus sign (τJ ~ 6) and with a blue plus sign (τJ ~ 2).
Current usage metrics show cumulative count of Article Views (full-text article views including HTML views, PDF and ePub downloads, according to the available data) and Abstracts Views on Vision4Press platform.
Data correspond to usage on the plateform after 2015. The current usage metrics is available 48-96 hours after online publication and is updated daily on week days.
Initial download of the metrics may take a while.