Fig. 23
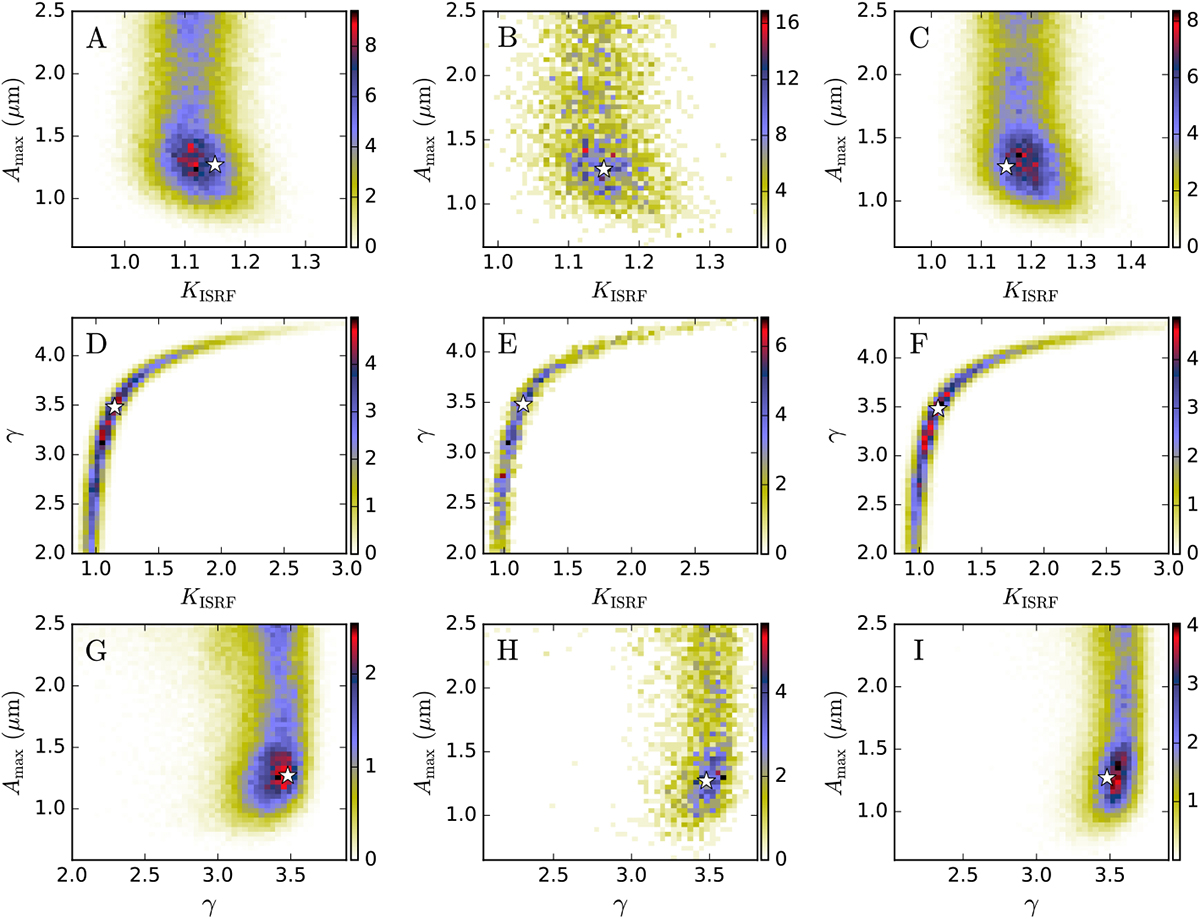
Marginalised probability distributions of dust parameters for the TMC-1N τJ = 6 position. The white star indicates the projected position of the χ2 minimum. Panels A, D, and G and C, F, and I show the marginalised probability integrated along the third parameter axis within ±5% of the χ2 minimum, respectively. Panels B, E, and H show the marginalised probability on the χ2 minimum.
Current usage metrics show cumulative count of Article Views (full-text article views including HTML views, PDF and ePub downloads, according to the available data) and Abstracts Views on Vision4Press platform.
Data correspond to usage on the plateform after 2015. The current usage metrics is available 48-96 hours after online publication and is updated daily on week days.
Initial download of the metrics may take a while.