Fig. 22
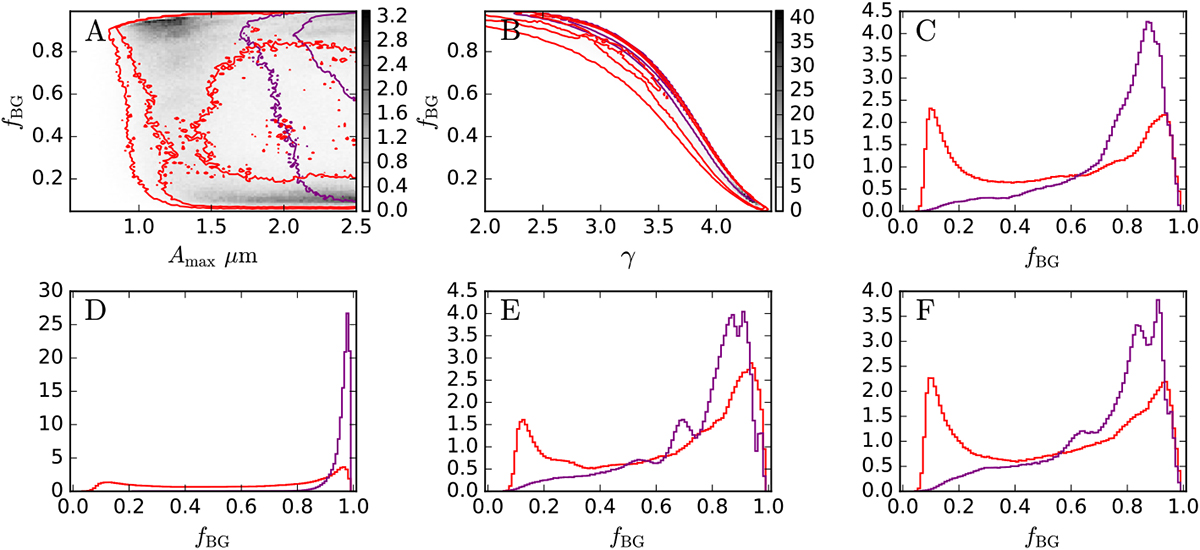
Massfraction of grains larger than 0.25 μm for τJ = 6 (red lines) and τJ = 2 (purple lines). For panels A–C, the Amax and γ values of the model with rSi = 0.5 and σNIR = 10% are used. Forpanel D, we use the previous model but assume σNIR = 20%. For panels Eand F, we use the models with the albedo of the grains decreased by 10% and the asymmetry parameter decreased by 10%, respectively. The greyscale colour maps correspond to the red lines and the contours show 1σ and 2σ.
Current usage metrics show cumulative count of Article Views (full-text article views including HTML views, PDF and ePub downloads, according to the available data) and Abstracts Views on Vision4Press platform.
Data correspond to usage on the plateform after 2015. The current usage metrics is available 48-96 hours after online publication and is updated daily on week days.
Initial download of the metrics may take a while.