Fig. 20
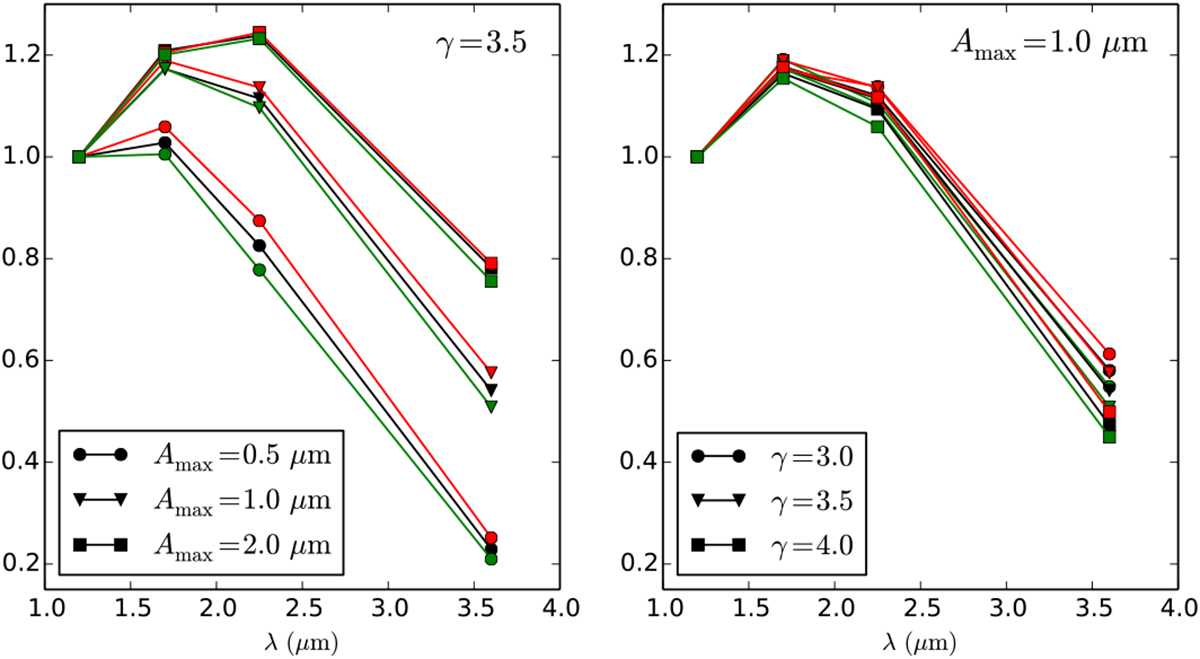
Near-infrared spectra derived from different dust models; a constant γ = 3.5 is used (left panel) and Amax = 1.0μm (right panel). The red and green lines are models where the albedo of the dust grains has been changed during the scattering computations by −10% (red) or by +10% (green), and the black line is a model where only the Amax and γ were varied during the scattering computations. Each symbol (circle, triangle, square) corresponds to a different Amax and γ value in the left and right panels, respectively.
Current usage metrics show cumulative count of Article Views (full-text article views including HTML views, PDF and ePub downloads, according to the available data) and Abstracts Views on Vision4Press platform.
Data correspond to usage on the plateform after 2015. The current usage metrics is available 48-96 hours after online publication and is updated daily on week days.
Initial download of the metrics may take a while.