Fig. 10
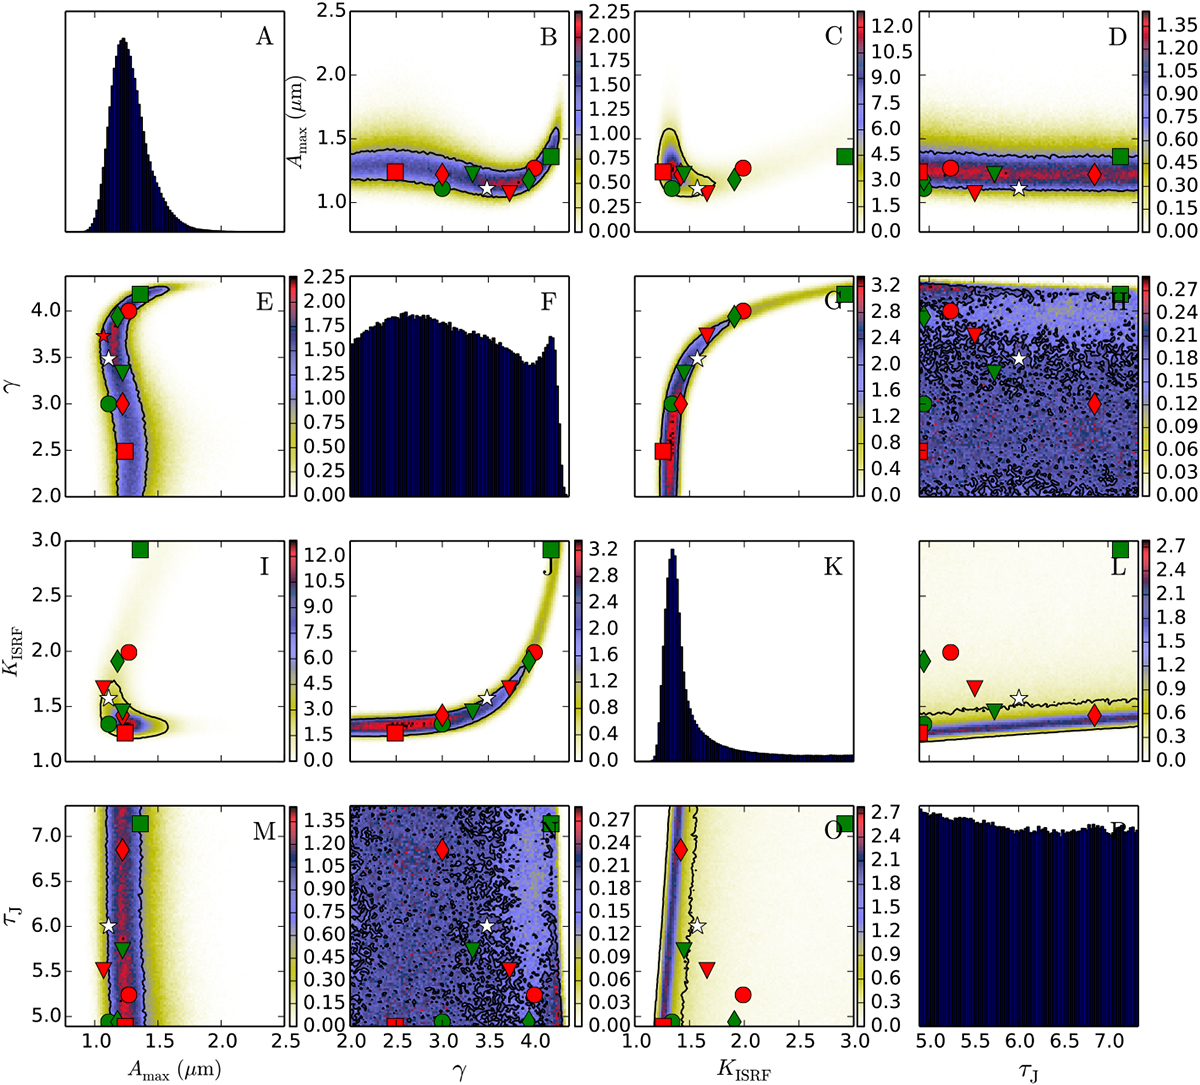
Marginalised one-dimensional probability distributions (panels A, F, K, and P) and two-dimensional projections of the probability of dust parameters for τJ = 6. The white star indicates the projected position of the χ2 minimum. The other symbols are the χ2 minima assuming a 10% higher or lower intensity for one of the bands, marked with green and red symbols, respectively. The circles correspond to J band, the diamonds to H band, the squares to K band, and the triangles to 3.6 μm band. The black contour shows the 1σ of the projection. The colour scale shows the normalised probability.
Current usage metrics show cumulative count of Article Views (full-text article views including HTML views, PDF and ePub downloads, according to the available data) and Abstracts Views on Vision4Press platform.
Data correspond to usage on the plateform after 2015. The current usage metrics is available 48-96 hours after online publication and is updated daily on week days.
Initial download of the metrics may take a while.