Fig. 6
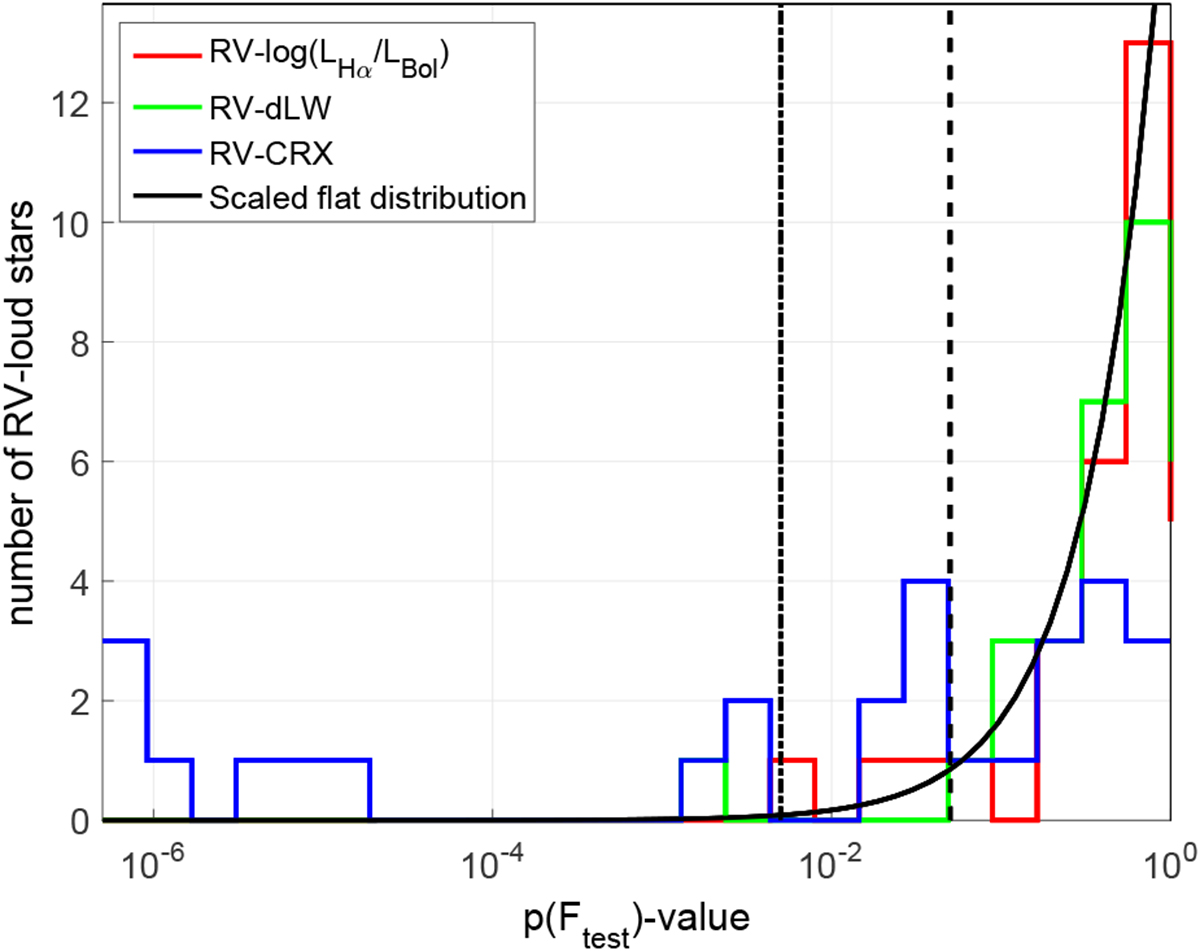
Histograms of p(Ftest) values of fitting a straight line to the RV–CRX, RV–dLW, and RV– log LHα∕Lbol scatter plots for the stars in Table 1. The solid black curve represents a uniform distribution between 0 and 1 scaled so that its integral is equal the number of RV-loud stars. The dashed vertical line is the critical p-value for suggestive evidence (0.05), and the dash-dotted vertical line is the critical p-value for significant evidence (0.005). The histogram is truncated at 5 × 10⁻⁷. Lower p-values are contained in the left-most column.
Current usage metrics show cumulative count of Article Views (full-text article views including HTML views, PDF and ePub downloads, according to the available data) and Abstracts Views on Vision4Press platform.
Data correspond to usage on the plateform after 2015. The current usage metrics is available 48-96 hours after online publication and is updated daily on week days.
Initial download of the metrics may take a while.