Fig. 4
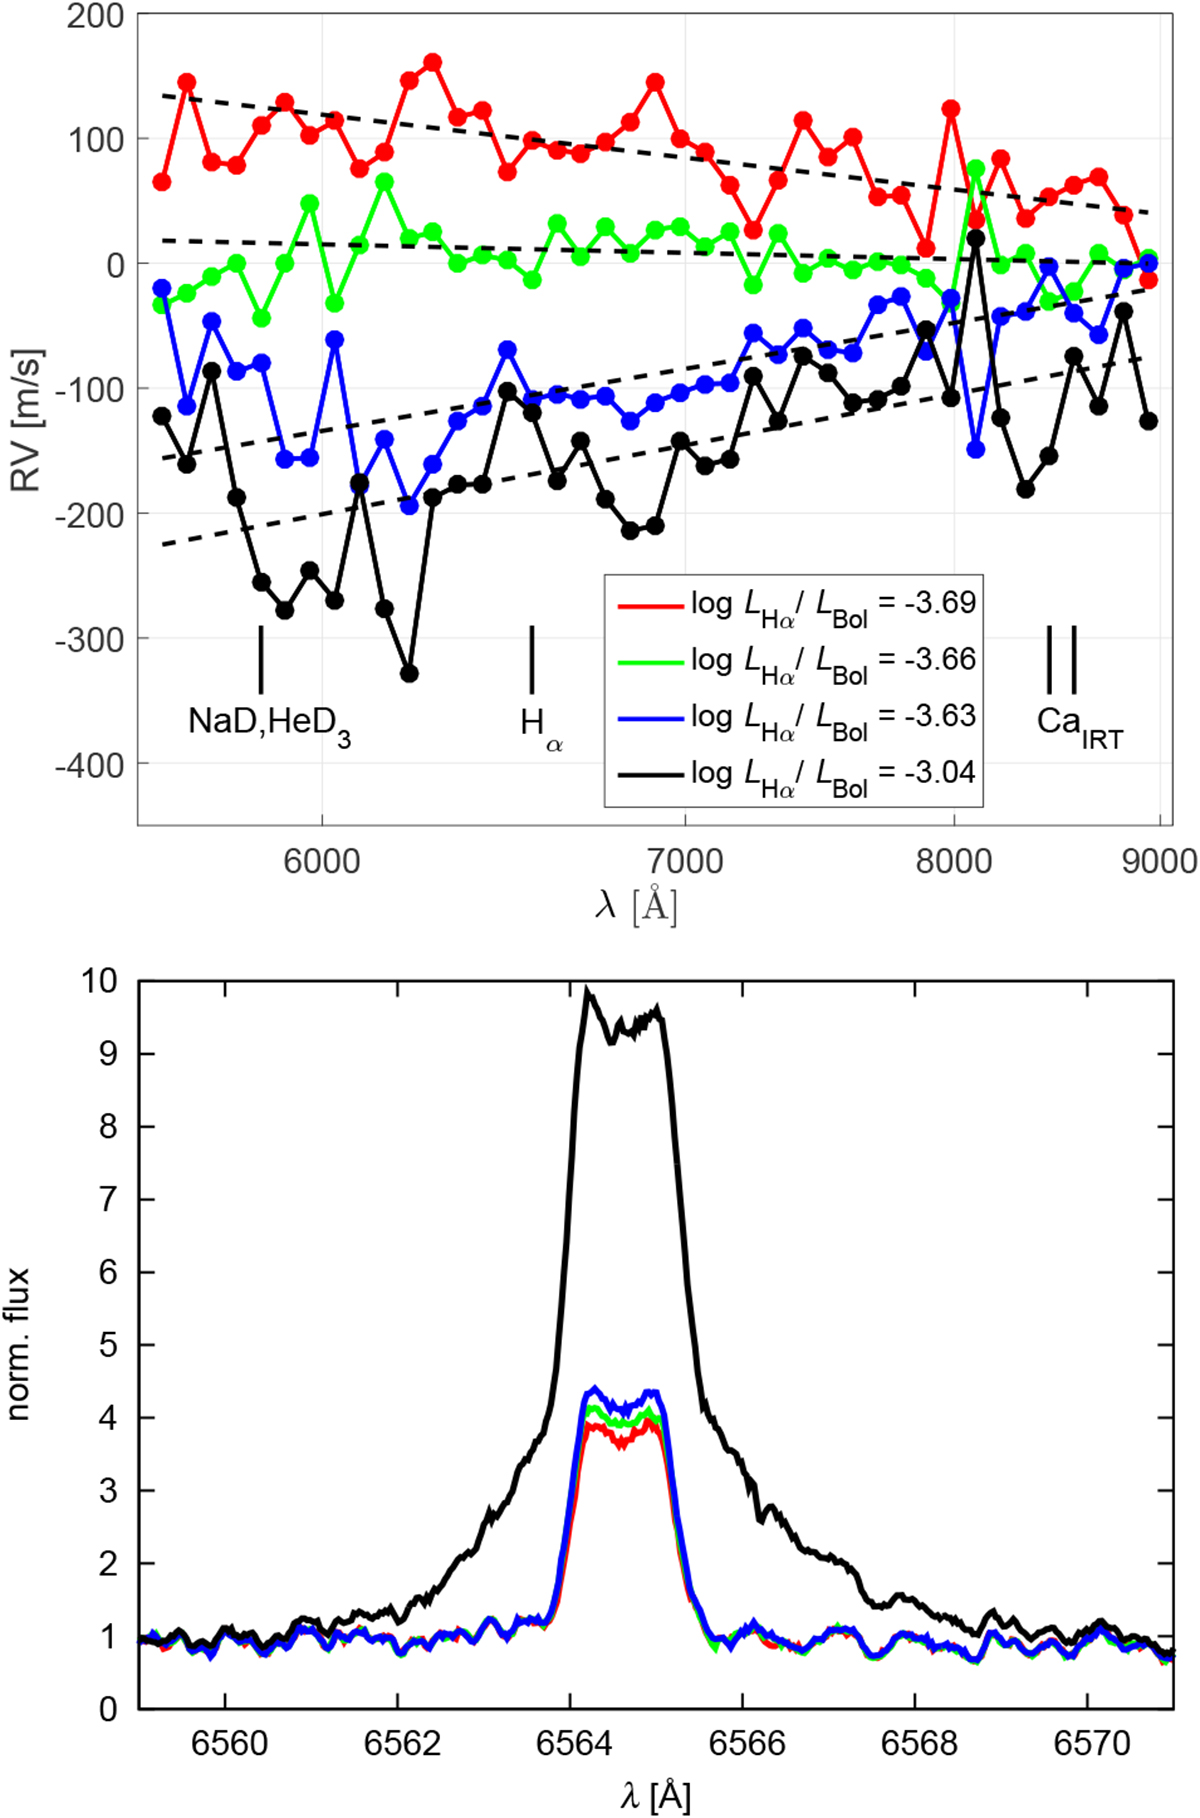
CARMENES VIS measurements of J22468+443 (EV Lac). Top: Order-by-order RVs from four representative observations. Red, green, and blue show three observations with close-to-median Hα emission. Black plots an observation with extremely high Hα emission, taken during a strong flare event (Fuhrmeister et al. 2018). The corresponding log LHα∕Lbol values are given in the inset. Dashed lines show the best-fit straight lines to the RV–order scatter plots of each observation. Individual-order RV uncertainties are not shown in the plot for clarity, but they are on the order of 10–30 m s−1, depending on the RV-information content and the S/N in each order. The markers at the bottom specify the locations of the indicated chromospheric emission lines. Bottom: Parts of the VIS spectra from these four observations, centered on the Hα line. The colors are the same as in the top panel.
Current usage metrics show cumulative count of Article Views (full-text article views including HTML views, PDF and ePub downloads, according to the available data) and Abstracts Views on Vision4Press platform.
Data correspond to usage on the plateform after 2015. The current usage metrics is available 48-96 hours after online publication and is updated daily on week days.
Initial download of the metrics may take a while.