Free Access
Fig. 1
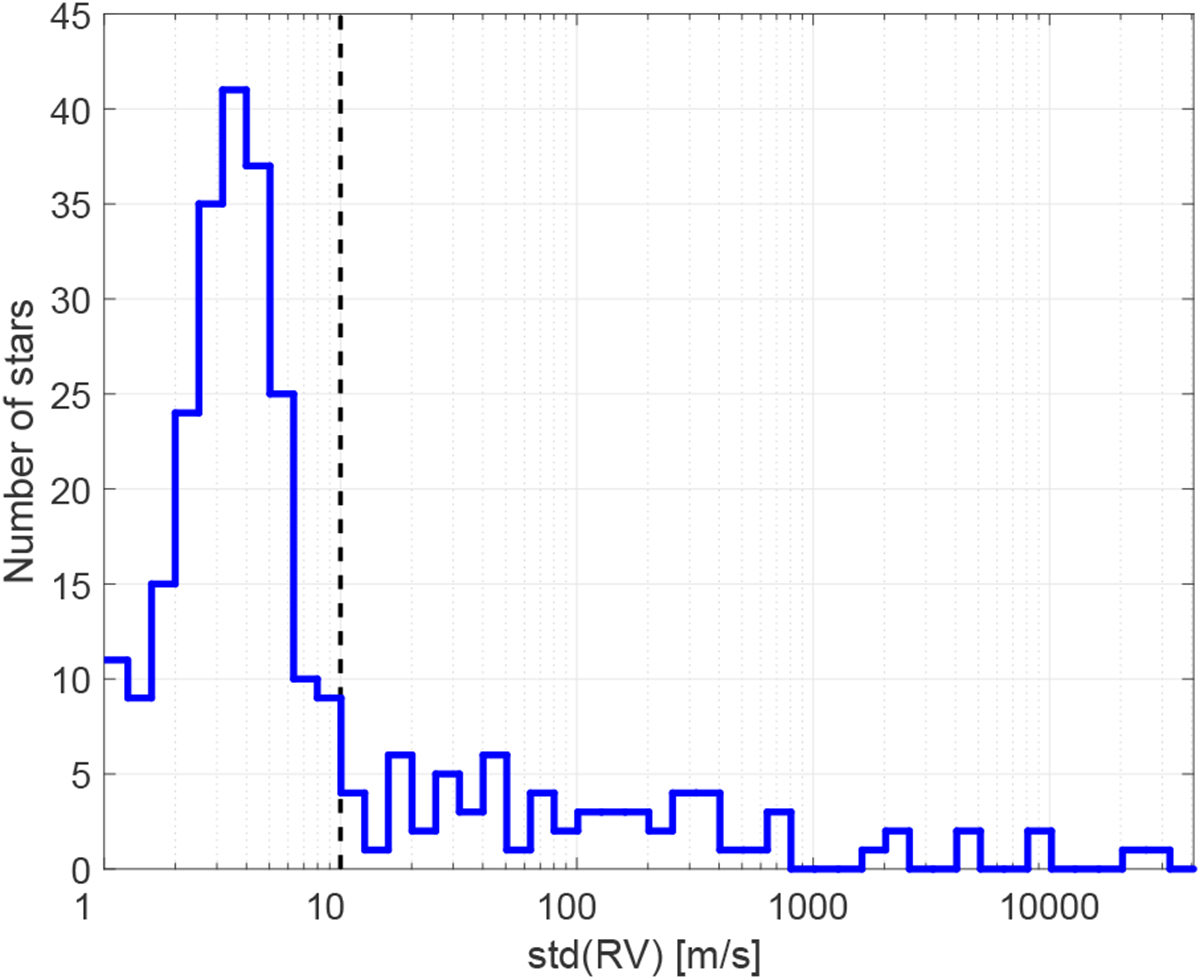
Histogram of std(RV) per star of the 287 stars that were observed at least five times before September 2017. The RVs used for this plot were derived from the CARMENES VIS spectra with SERVAL (Zechmeister et al. 2018). The dashed line is the adopted boundary between RV-quiet and RV-loud stars at std(RV) = 10 m s−1.
Current usage metrics show cumulative count of Article Views (full-text article views including HTML views, PDF and ePub downloads, according to the available data) and Abstracts Views on Vision4Press platform.
Data correspond to usage on the plateform after 2015. The current usage metrics is available 48-96 hours after online publication and is updated daily on week days.
Initial download of the metrics may take a while.