Fig. 8
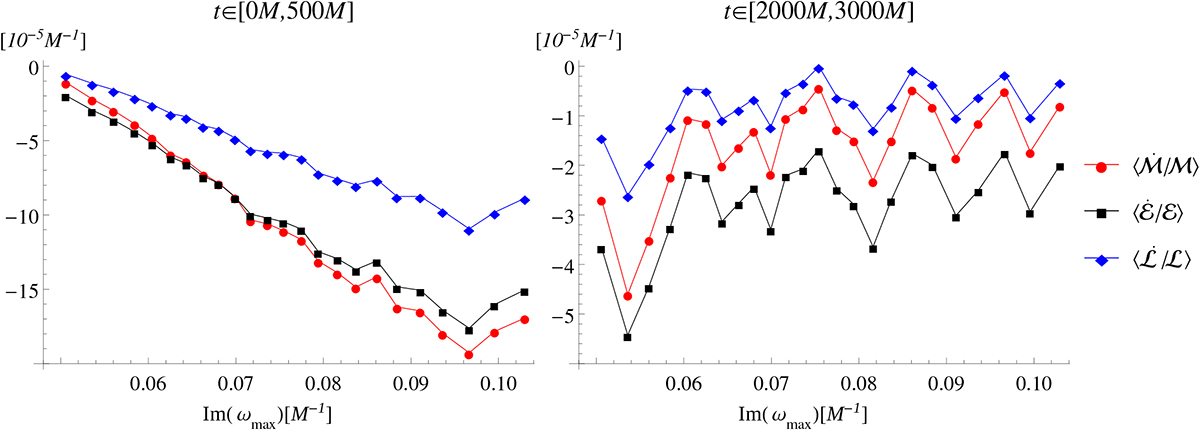
Numerically obtained accretion rates of rest mass ![]() , energy
, energy ![]() and angular momentum
and angular momentum ![]() averaged over the evolution time intervals [0, 1000 M] and [2000 M, 3000 M] as a functionof the initial MRI growth rate estimate Im(ωmax). We note that a lower negative value of
averaged over the evolution time intervals [0, 1000 M] and [2000 M, 3000 M] as a functionof the initial MRI growth rate estimate Im(ωmax). We note that a lower negative value of ![]() corresponds to a higher loss rate of the quantity from the torus and thus a higher accretion rate. The displayed values correspond to the parameter κ in the interval [−1, 1.31].
corresponds to a higher loss rate of the quantity from the torus and thus a higher accretion rate. The displayed values correspond to the parameter κ in the interval [−1, 1.31].
Current usage metrics show cumulative count of Article Views (full-text article views including HTML views, PDF and ePub downloads, according to the available data) and Abstracts Views on Vision4Press platform.
Data correspond to usage on the plateform after 2015. The current usage metrics is available 48-96 hours after online publication and is updated daily on week days.
Initial download of the metrics may take a while.