Fig. 10
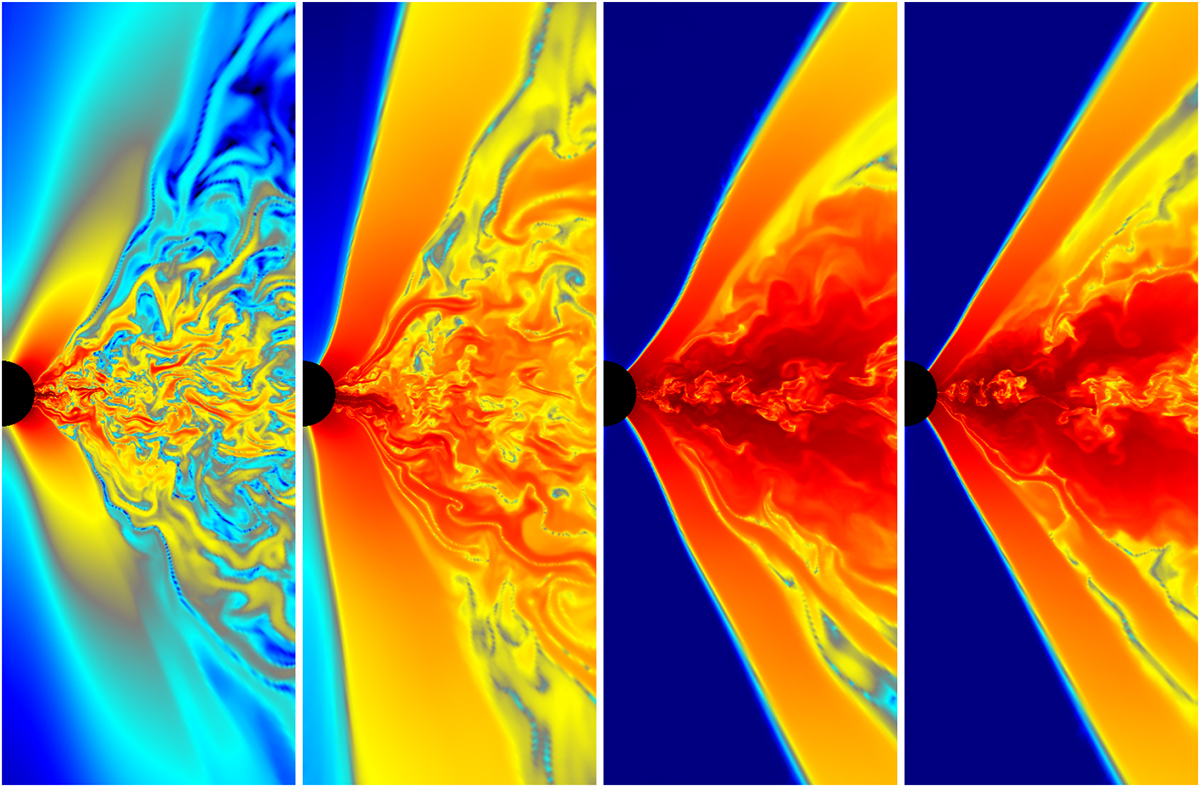
Snapshots of the structure of the magnetic fields for different tori evolutions plotted in Boyer–Lindquist coordinates. The color indicates ![]() , where
, where ![]() is the maximal strength of the magnetic field in the respective image, the black circle is the interior of the black hole, and the right equatorial edge of the image is at r = 12M. The first twoimages on the left are snapshots for the κ = −0.48 torus before and after the first
is the maximal strength of the magnetic field in the respective image, the black circle is the interior of the black hole, and the right equatorial edge of the image is at r = 12M. The first twoimages on the left are snapshots for the κ = −0.48 torus before and after the first ![]() peak, at t = 1200 M and t =1700 M respectively (c.f. Fig. 9). The other two images on the right are snapshots for the “
peak, at t = 1200 M and t =1700 M respectively (c.f. Fig. 9). The other two images on the right are snapshots for the “![]() -quiescent” κ = 1.2 torus at t = 1200 M and t =1700 M respectively. It appears that the behavior of
-quiescent” κ = 1.2 torus at t = 1200 M and t =1700 M respectively. It appears that the behavior of ![]() is linked with the evolution of the coronal layer.
is linked with the evolution of the coronal layer.
Current usage metrics show cumulative count of Article Views (full-text article views including HTML views, PDF and ePub downloads, according to the available data) and Abstracts Views on Vision4Press platform.
Data correspond to usage on the plateform after 2015. The current usage metrics is available 48-96 hours after online publication and is updated daily on week days.
Initial download of the metrics may take a while.